Design Library
Explore Designs
New Merch Designs
Trending Merch Designs
Vectors
PNGs & SVGs
Mockups
T-Shirts
T-Shirt PSD Templates
KDP Designs
Phone Cases
Pillows
Tote Bags
Posters
Mugs
Design Tools
Designer
New!
T-shirt Maker
Mockup Generator
Quote Generator
Logo Maker
Resources
Merch Digest
Blog
Help Center
Creators Program
Learn About Merch
Changelog
Pricing
Loading...
Sign Up
Login
Icons
graph
Design Library
Explore Designs
New Merch Designs
Trending Merch Designs
Vectors
PNGs & SVGs
Mockups
T-Shirts
T-Shirt PSD Templates
KDP Designs
Phone Cases
Pillows
Tote Bags
Posters
Mugs
Design Tools
Designer
New!
T-shirt Maker
Mockup Generator
Quote Generator
Logo Maker
Resources
Merch Digest
Blog
Help Center
Creators Program
Learn About Merch
Changelog
PLANS
Icons
graph
363 graph Icons in SVG, PNG, AI
Download graph Icons in SVG, PNG, AI for commercial use.
Related:
graphics
,
graphic
,
graphical
Sort by
Most relevant
Sponsored results by
Get 15% off with code: VEXELS15
Show more
×
We didn't find any
graph
Icons, but here's all our
graph
designs or
request design here
Premium
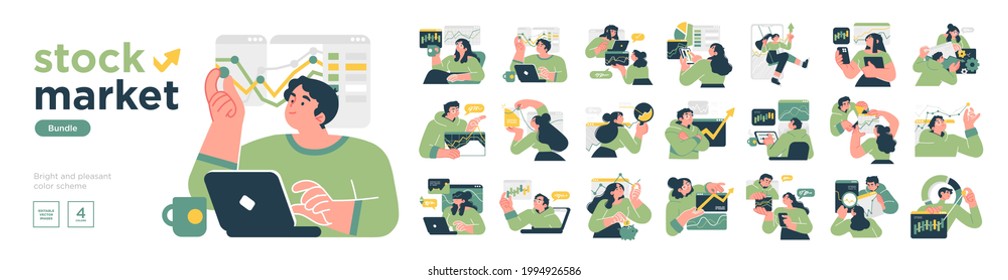
Growing graph stroke icon PNG Design
Choose a folder
All favorites
Create new
Save
Growing graph stroke icon PNG Design
Hyperbolic function graph flat PNG Design
Choose a folder
All favorites
Create new
Save
Hyperbolic function graph flat PNG Design
Hyperbolic function graph stroke PNG Design
Choose a folder
All favorites
Create new
Save
Hyperbolic function graph stroke PNG Design
Logarithmic function graph doodle PNG Design
Choose a folder
All favorites
Create new
Save
Logarithmic function graph doodle PNG Design
Column graph tool PNG Design
Choose a folder
All favorites
Create new
Save
Column graph tool PNG Design
Bar graph inside computer window icon bar graph PNG Design
Choose a folder
All favorites
Create new
Save
Bar graph inside computer window icon bar graph PNG Design
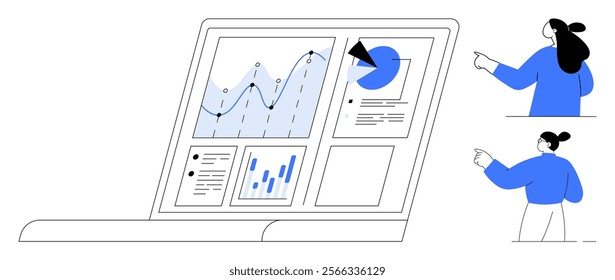
Graph curve flat PNG Design
Choose a folder
All favorites
Create new
Save
Graph curve flat PNG Design
Growing graph icon PNG Design
Choose a folder
All favorites
Create new
Save
Growing graph icon PNG Design
Growing graph icon stroke pink PNG Design
Choose a folder
All favorites
Create new
Save
Growing graph icon stroke pink PNG Design
Premium
Graph square icon PNG Design
Choose a folder
All favorites
Create new
Save
Graph square icon PNG Design
Bar graph inside computer window icon PNG Design
Choose a folder
All favorites
Create new
Save
Bar graph inside computer window icon PNG Design
Graph flat icon PNG Design
Choose a folder
All favorites
Create new
Save
Graph flat icon PNG Design
Clockwise movement graph stroke PNG Design
Choose a folder
All favorites
Create new
Save
Clockwise movement graph stroke PNG Design
Graph curve doodle PNG Design
Choose a folder
All favorites
Create new
Save
Graph curve doodle PNG Design
Area graph tool PNG Design
Choose a folder
All favorites
Create new
Save
Area graph tool PNG Design
Premium
Growing graph screen stroke icon PNG Design
Choose a folder
All favorites
Create new
Save
Growing graph screen stroke icon PNG Design
Premium
Stacked bar graph tool PNG Design
Choose a folder
All favorites
Create new
Save
Stacked bar graph tool PNG Design
Clockwise movement graph flat PNG Design
Choose a folder
All favorites
Create new
Save
Clockwise movement graph flat PNG Design
Hyperbolic function graph PNG Design
Choose a folder
All favorites
Create new
Save
Hyperbolic function graph PNG Design
Logarithmic function graph stroke PNG Design
Choose a folder
All favorites
Create new
Save
Logarithmic function graph stroke PNG Design
Print ready
Premium
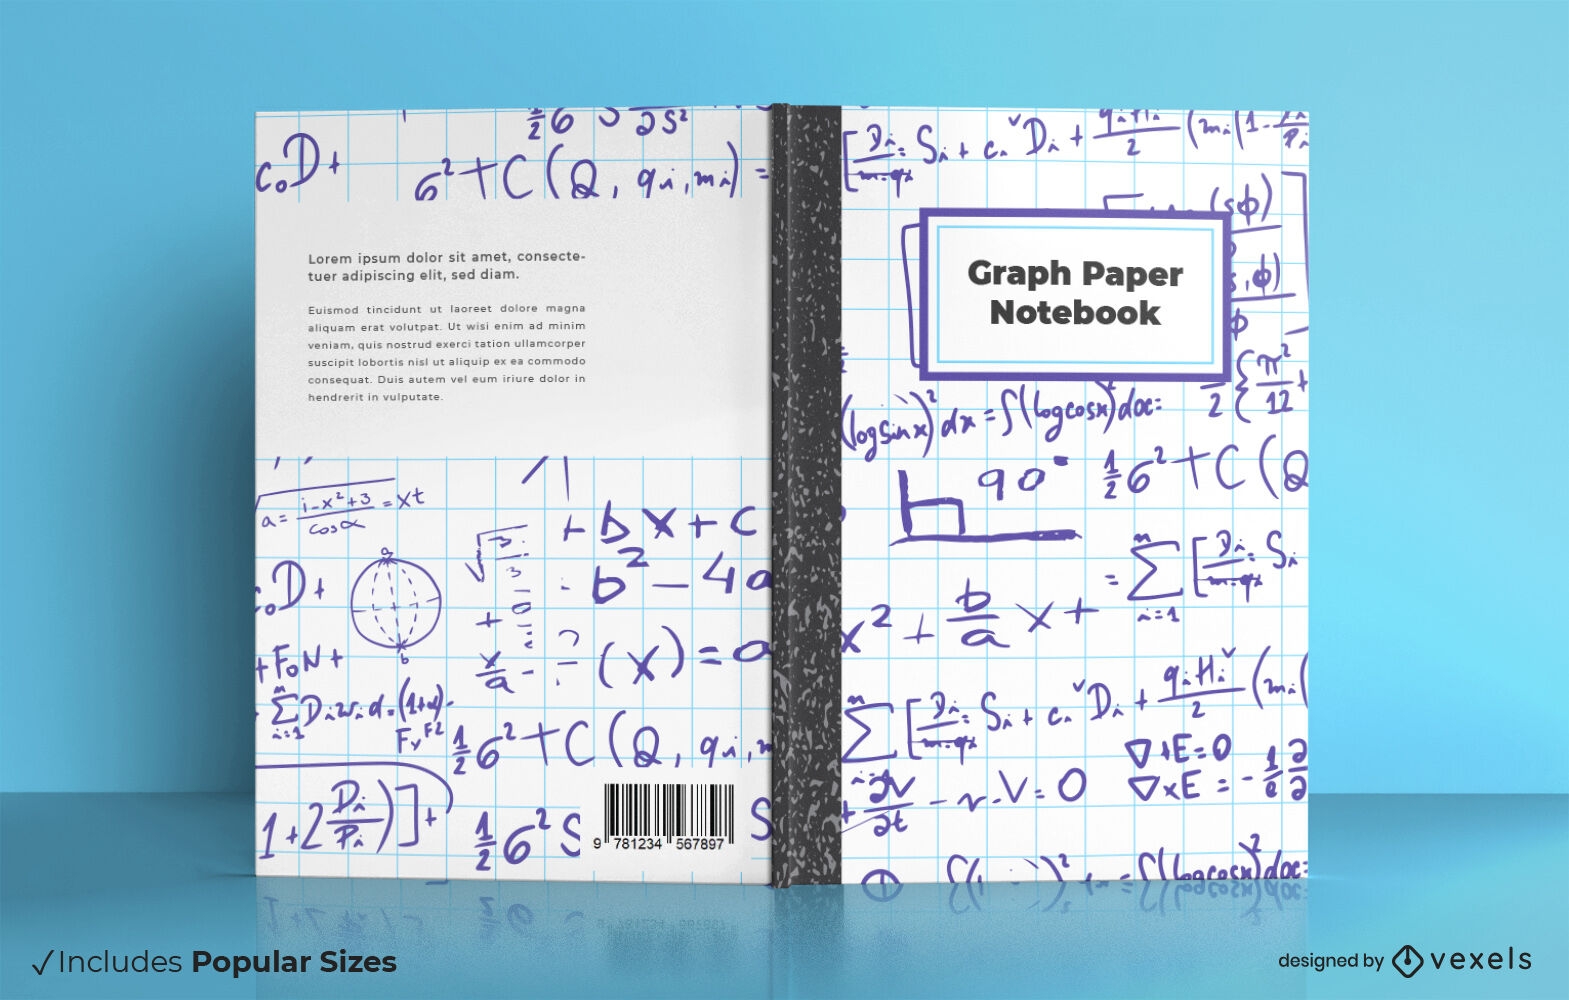
Cool graph paper book cover design
Choose a folder
All favorites
Create new
Save
Cool graph paper book cover design
Cryptocurrency price graph
Choose a folder
All favorites
Create new
Save
Cryptocurrency price graph
Print ready
Premium
Graph paper book cover design
Choose a folder
All favorites
Create new
Save
Graph paper book cover design
Editable text
Print ready
Premium
Math symbols book cover design
Choose a folder
All favorites
Create new
Save
Math symbols book cover design
Premium
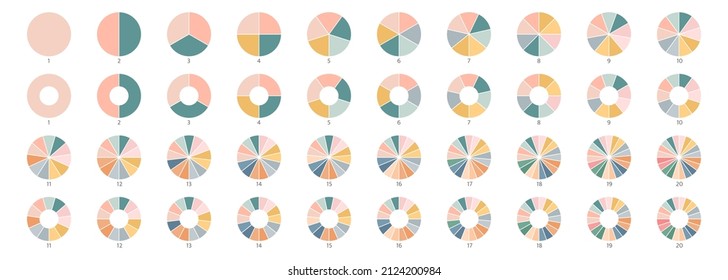
Blue pie chart PNG Design
Choose a folder
All favorites
Create new
Save
Blue pie chart PNG Design
Editable text
Print ready
Premium
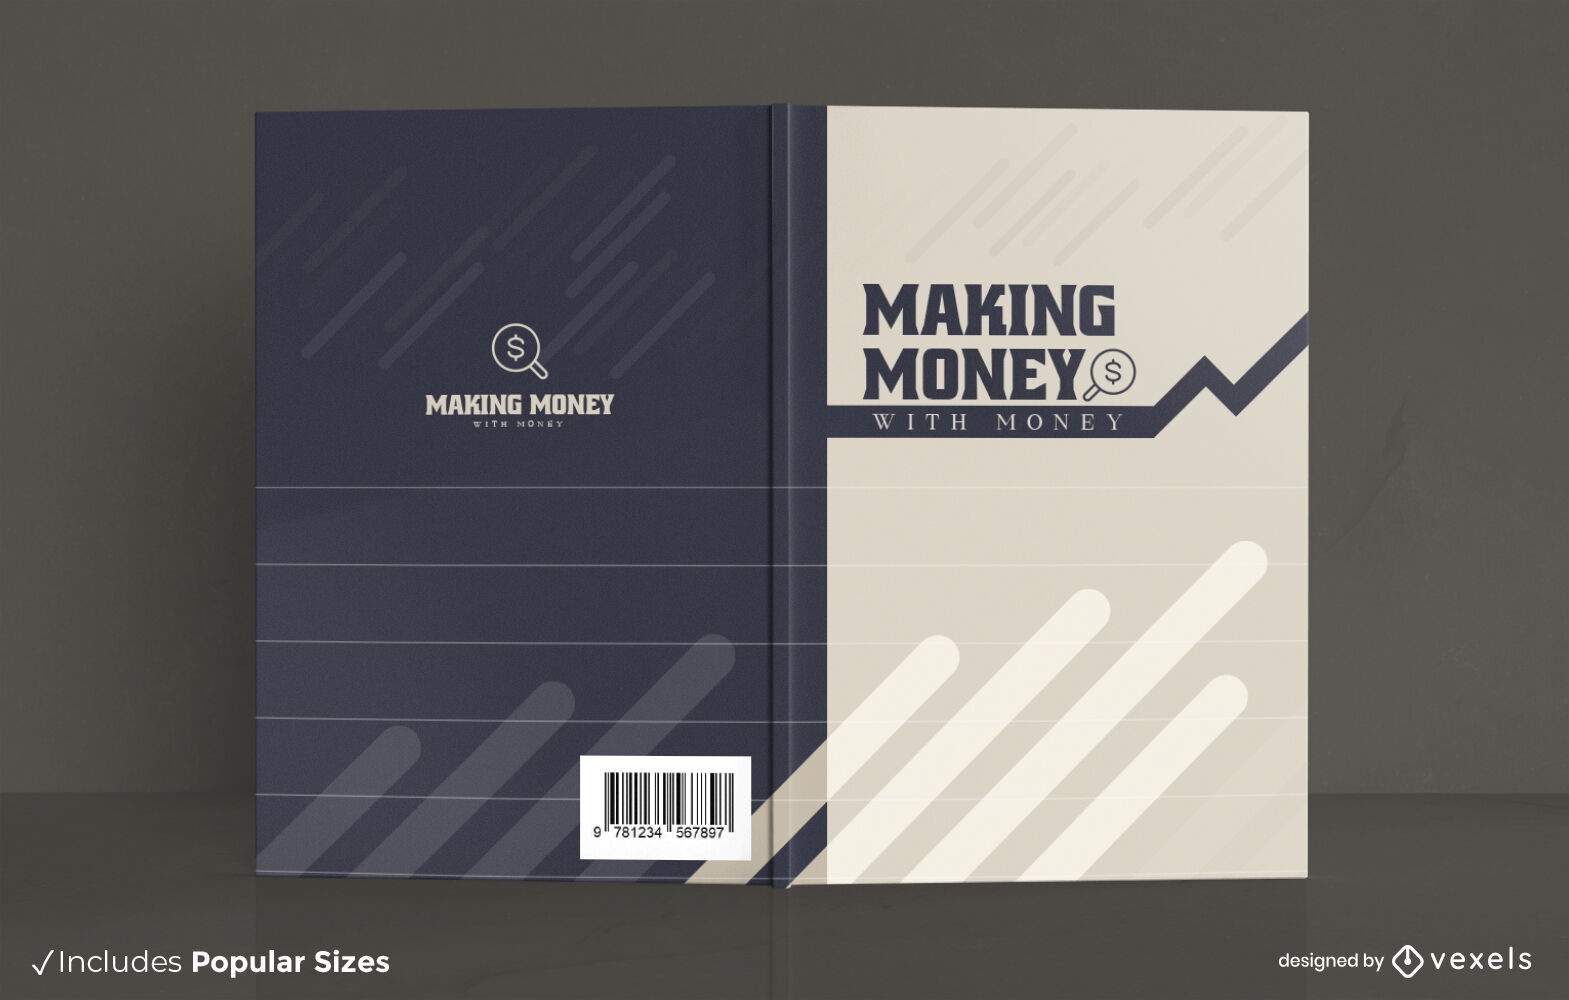
Money graphic line book cover design
Choose a folder
All favorites
Create new
Save
Money graphic line book cover design
Editable text
Print ready
Premium
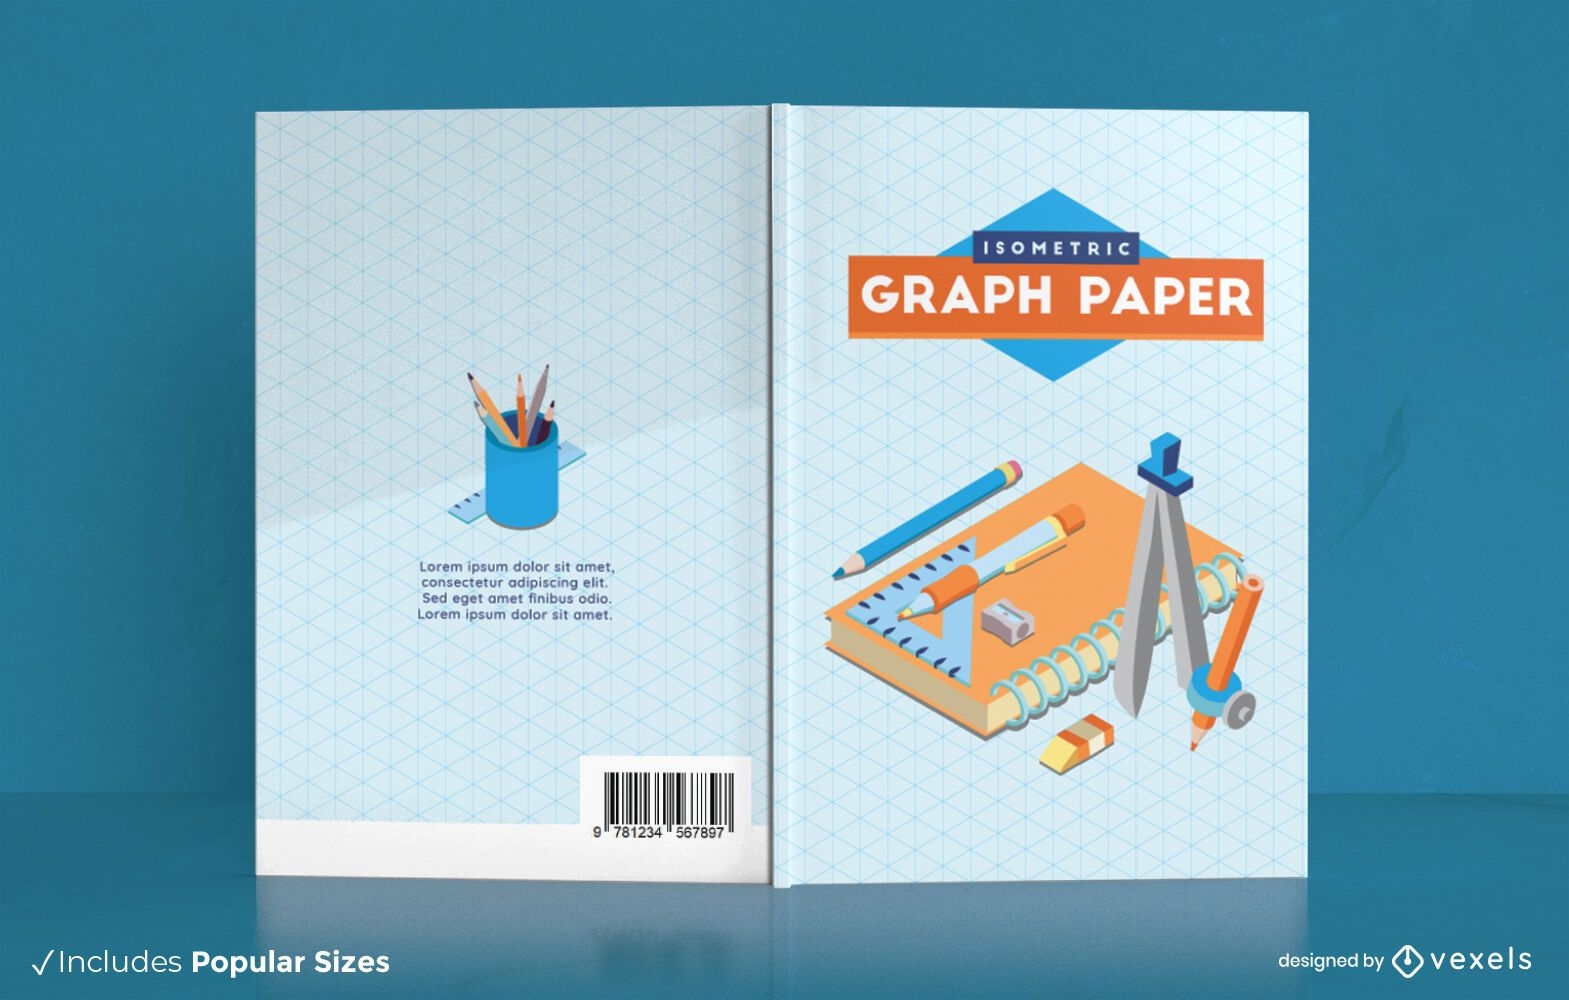
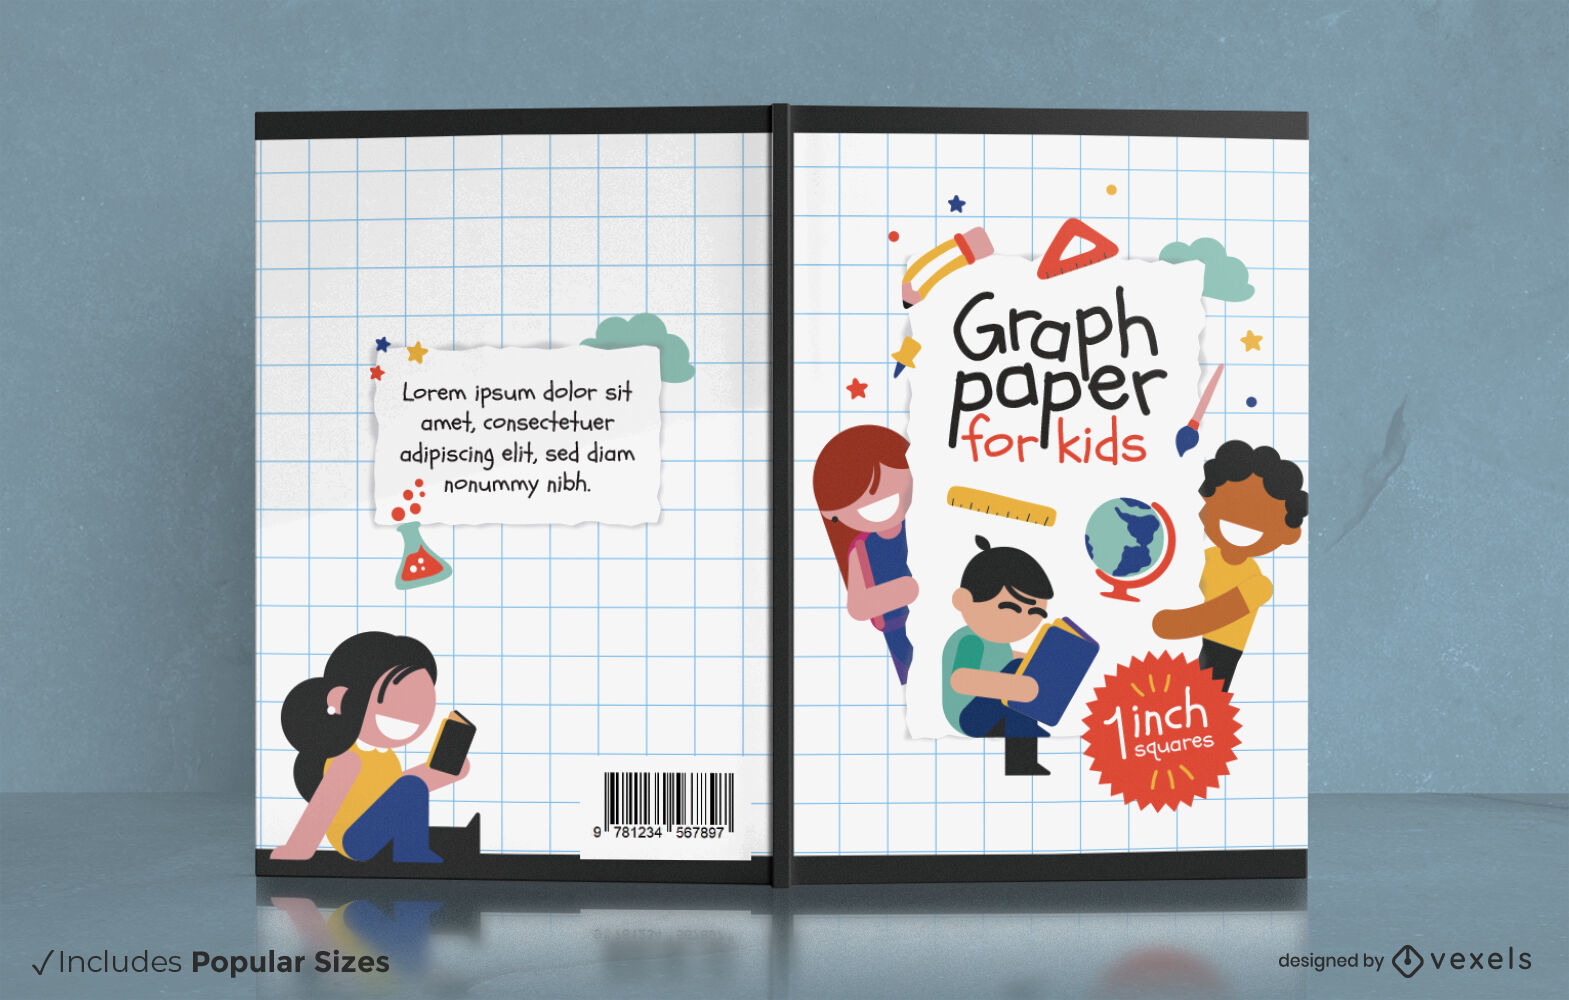
Graph paper for kids book cover design
Choose a folder
All favorites
Create new
Save
Graph paper for kids book cover design
Premium
Orange pie chart PNG Design
Choose a folder
All favorites
Create new
Save
Orange pie chart PNG Design
Premium
Purple pie chart PNG Design
Choose a folder
All favorites
Create new
Save
Purple pie chart PNG Design
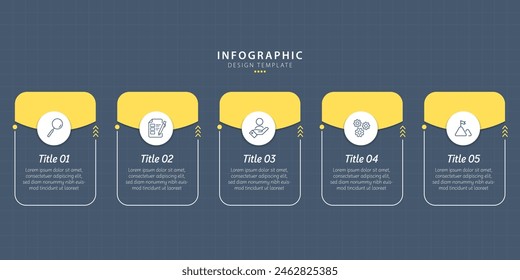
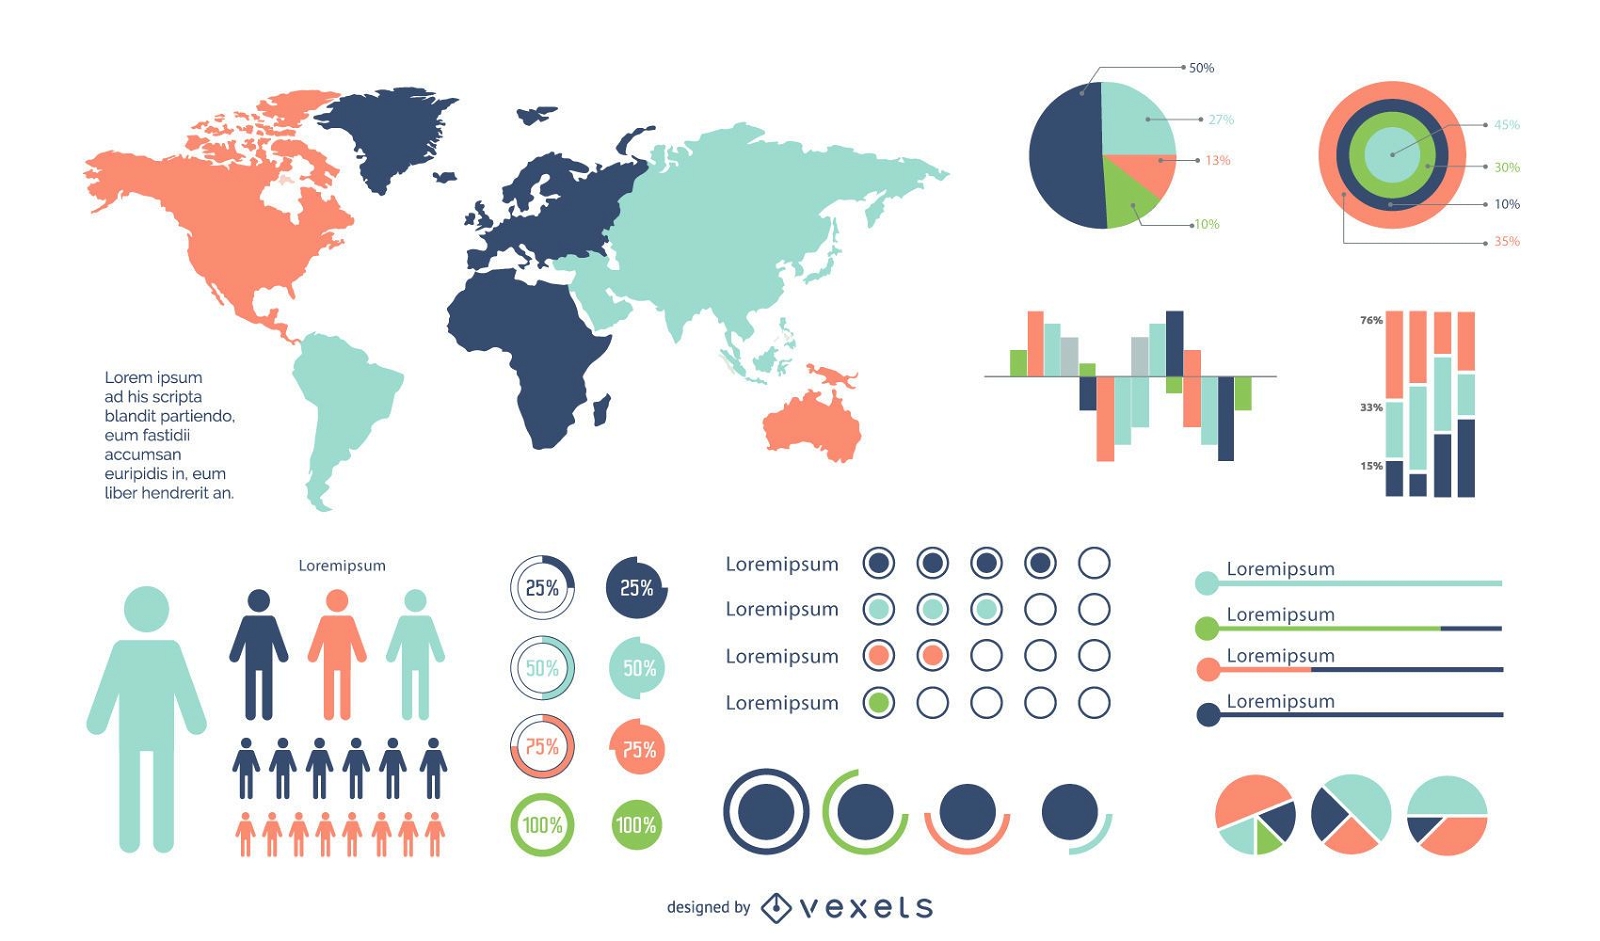
Minimal Colorful Infographic Set
Choose a folder
All favorites
Create new
Save
Minimal Colorful Infographic Set
Premium
Blue pie chart 1 PNG Design
Choose a folder
All favorites
Create new
Save
Blue pie chart 1 PNG Design
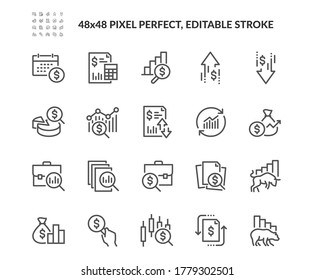
Business and finance icons set
Choose a folder
All favorites
Create new
Save
Business and finance icons set
Blue Tech Fluorescent Financial Chart Background
Choose a folder
All favorites
Create new
Save
Blue Tech Fluorescent Financial Chart Background
Elegant Business Icon Circle Pack
Choose a folder
All favorites
Create new
Save
Elegant Business Icon Circle Pack
Business woman failure illustration
Choose a folder
All favorites
Create new
Save
Business woman failure illustration
Business man failure
Choose a folder
All favorites
Create new
Save
Business man failure
Business man bankrupt
Choose a folder
All favorites
Create new
Save
Business man bankrupt
78 Menu tool icons set
Choose a folder
All favorites
Create new
Save
78 Menu tool icons set
Beautiful Financial Icon Set
Choose a folder
All favorites
Create new
Save
Beautiful Financial Icon Set
Clean 3D Diagram Icons
Choose a folder
All favorites
Create new
Save
Clean 3D Diagram Icons
3D Grey Beautiful Business Infographic Layout
Choose a folder
All favorites
Create new
Save
3D Grey Beautiful Business Infographic Layout
Glossy Pie Chart
Choose a folder
All favorites
Create new
Save
Glossy Pie Chart
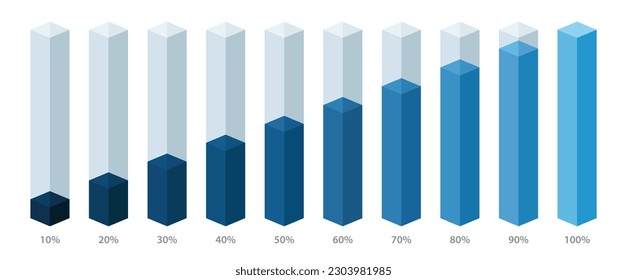
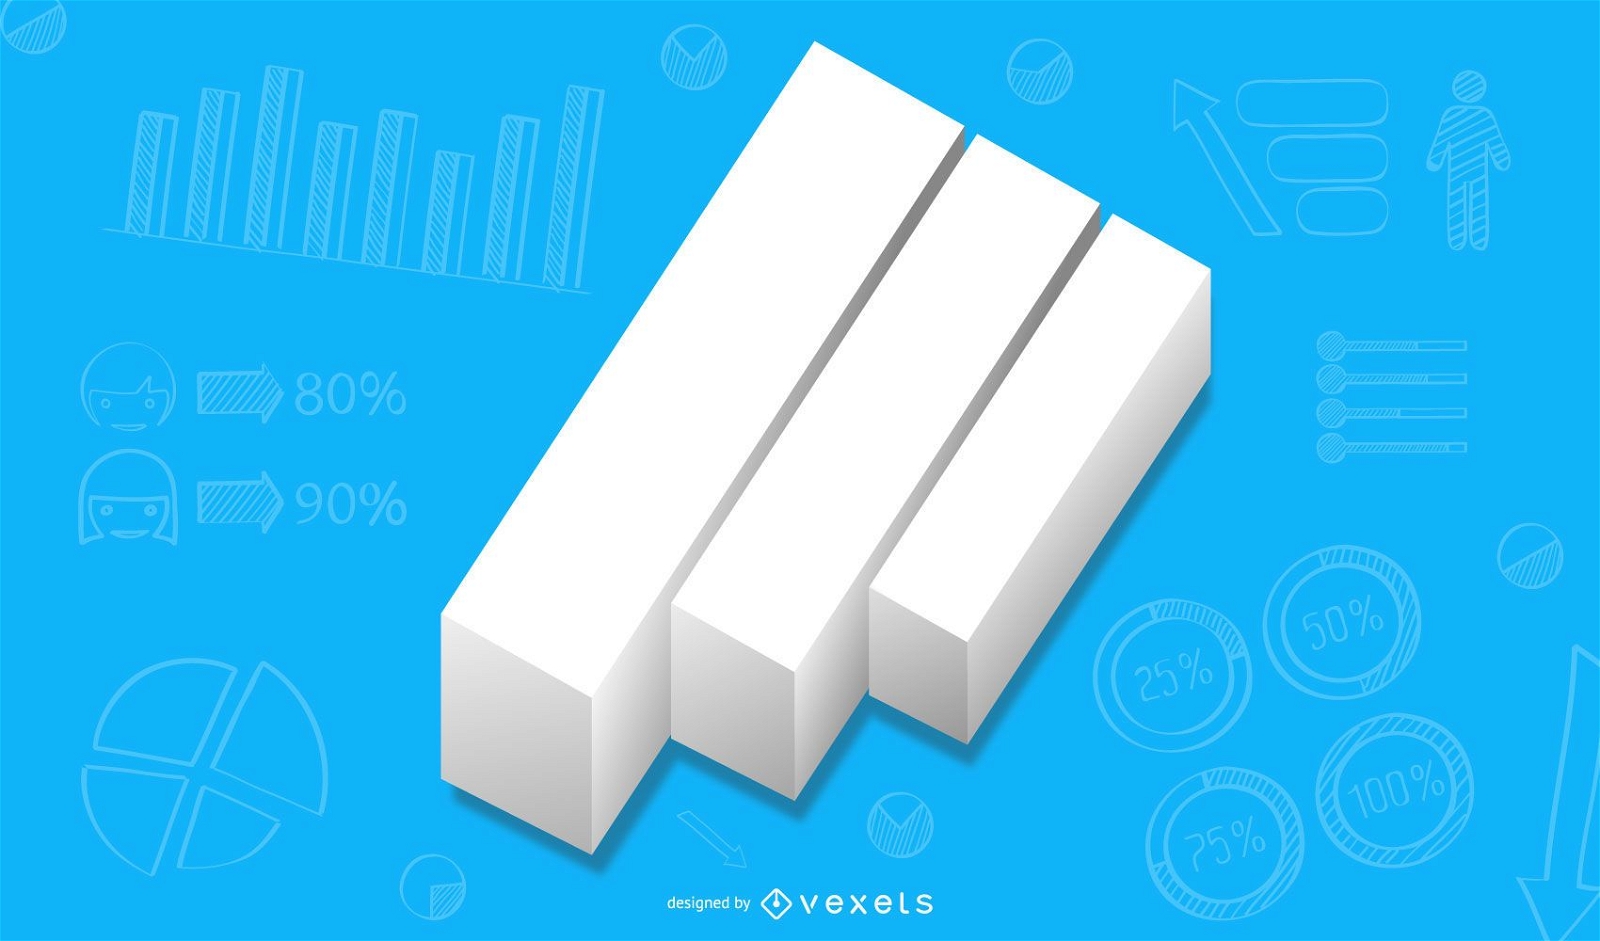
Minimal 3D Laying Down Growing Graph
Choose a folder
All favorites
Create new
Save
Minimal 3D Laying Down Growing Graph
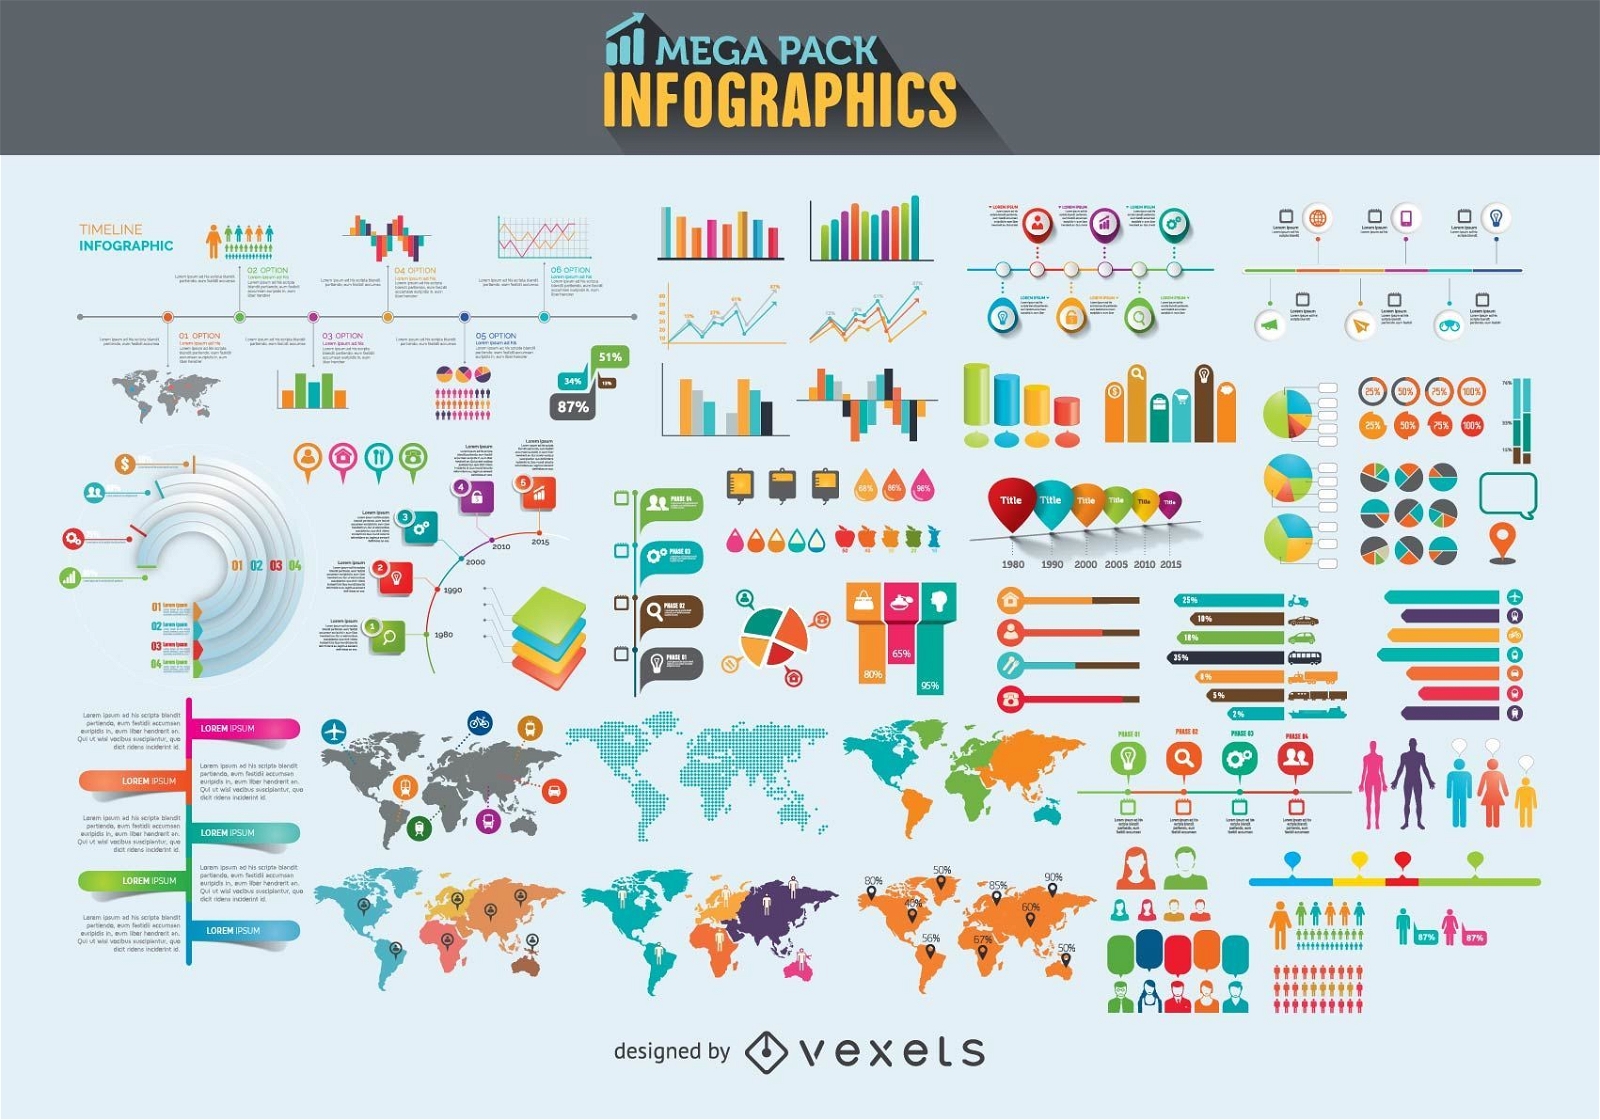
Infographics elements mega pack
Choose a folder
All favorites
Create new
Save
Infographics elements mega pack
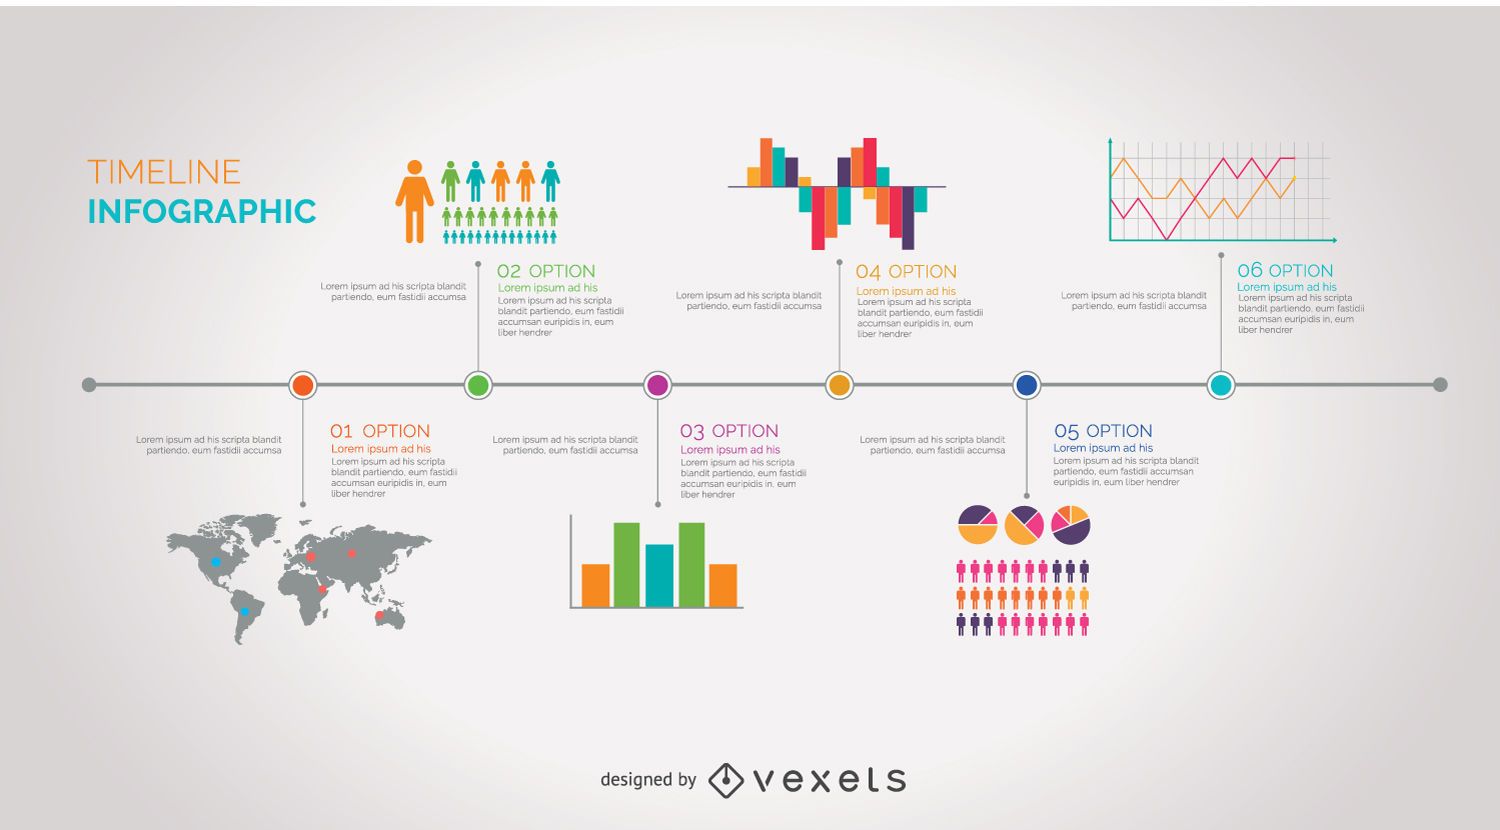
Infographic Timeline
Choose a folder
All favorites
Create new
Save
Infographic Timeline
Premium
Stock and finances color stroke icons
Choose a folder
All favorites
Create new
Save
Stock and finances color stroke icons
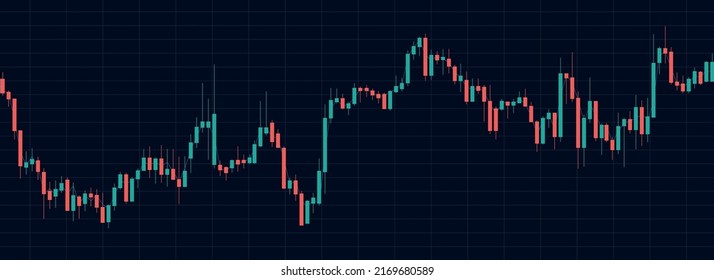
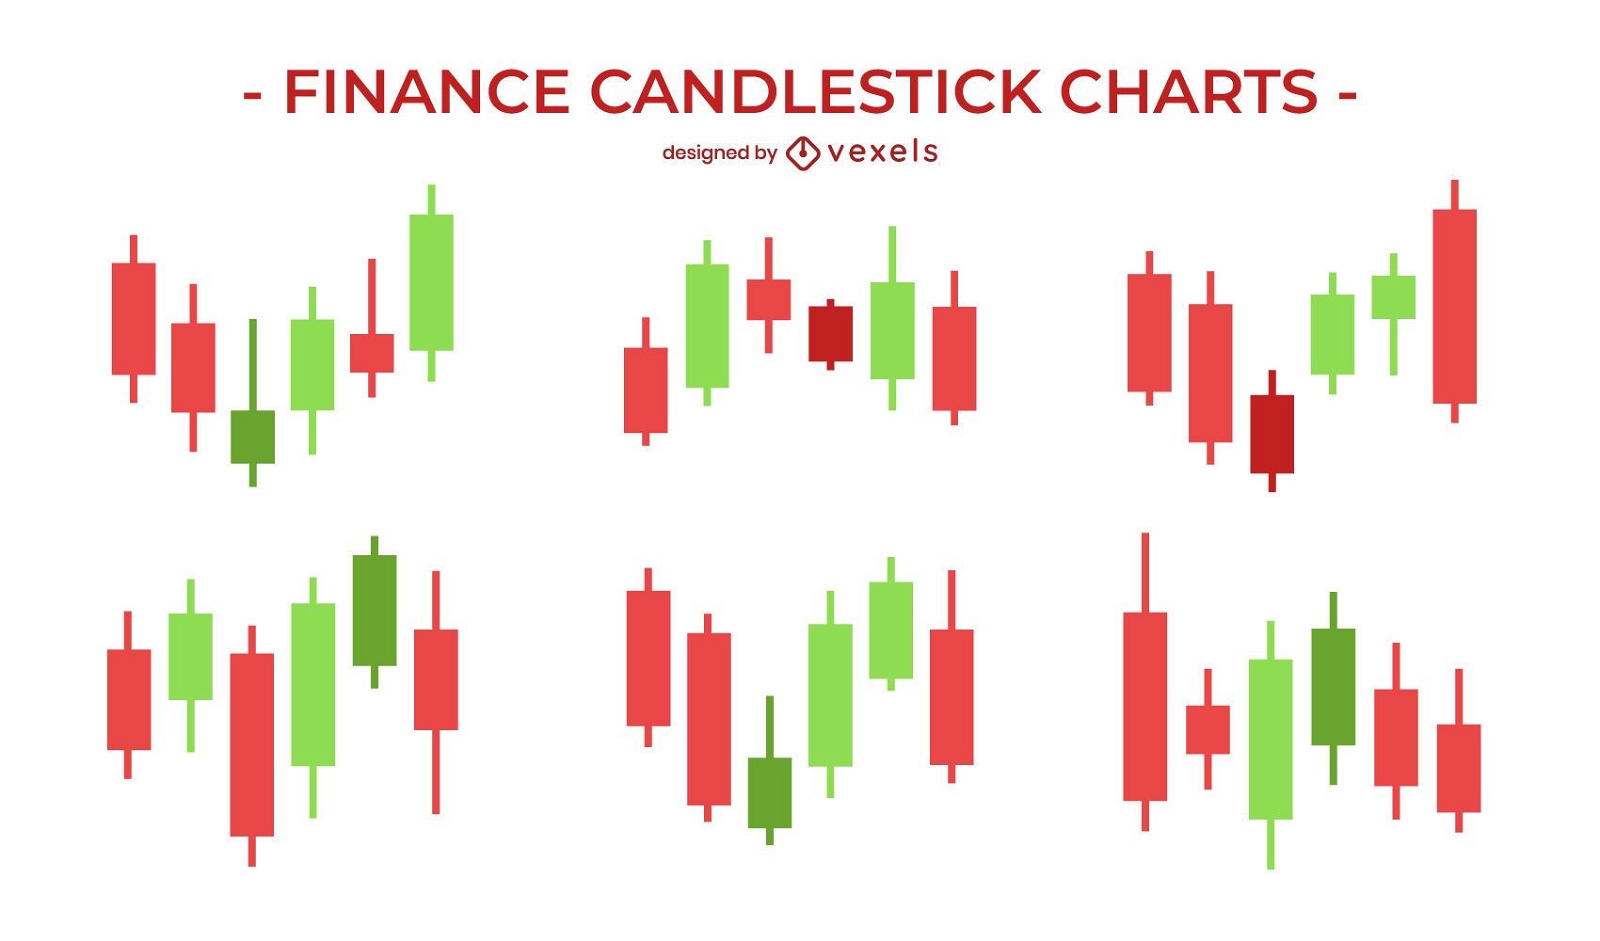
Finance candlestick chart set
Choose a folder
All favorites
Create new
Save
Finance candlestick chart set
Heart with life line
Choose a folder
All favorites
Create new
Save
Heart with life line
50 percent progress circle PNG Design
Choose a folder
All favorites
Create new
Save
50 percent progress circle PNG Design
Premium
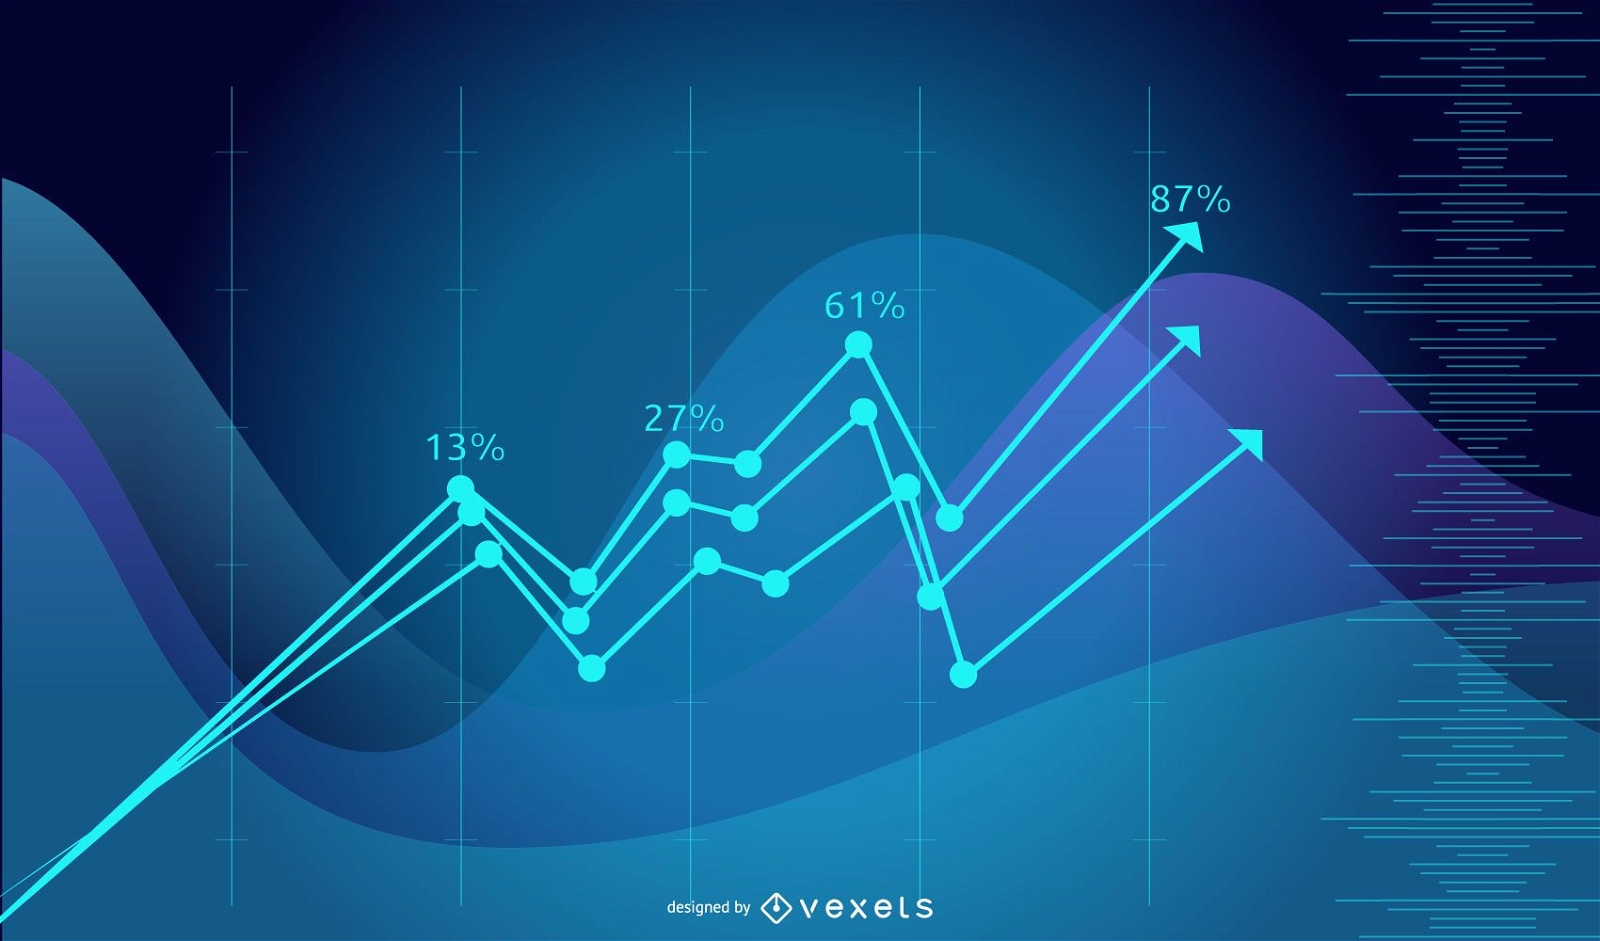
Increasing multicolor line chart PNG Design
Choose a folder
All favorites
Create new
Save
Increasing multicolor line chart PNG Design
Subscribe
To Get High-Quality Commercial Use Designs For Your Business
SEE PLANS
Next
of 8
prev page
next page