Design Library
New Merch Designs
T-Shirts
Vectors
Trending Merch Designs
PNGs & SVGs
Mockups
T-Shirt PSD Templates
Explore Designs
KDP Designs
Posters
Mugs
Phone Cases
Tote Bags
Pillows
Design Tools
Merch Designer
New!
Mockup Generator
AI Design Generator
Image Vectorizer
Quote Generator
T-Shirt Maker (Old)
Resources
Merch Digest
Blog
Help Center
Learn About Merch
Feedback
Corporate Solutions
Enterprise
API Access
Design Studio
Bulk Design Production
Pricing
Loading...
Sign Up
Login
All
chart
infographic
Design Library
New Merch Designs
T-Shirts
Vectors
Trending Merch Designs
PNGs & SVGs
Mockups
T-Shirt PSD Templates
Explore Designs
KDP Designs
Posters
Mugs
Phone Cases
Tote Bags
Pillows
Design Tools
Merch Designer
New!
Mockup Generator
AI Design Generator
Image Vectorizer
Quote Generator
T-Shirt Maker (Old)
Resources
Merch Digest
Blog
Help Center
Learn About Merch
Feedback
Corporate Solutions
Enterprise
API Access
Design Studio
Bulk Design Production
PLANS
All
chart
infographic
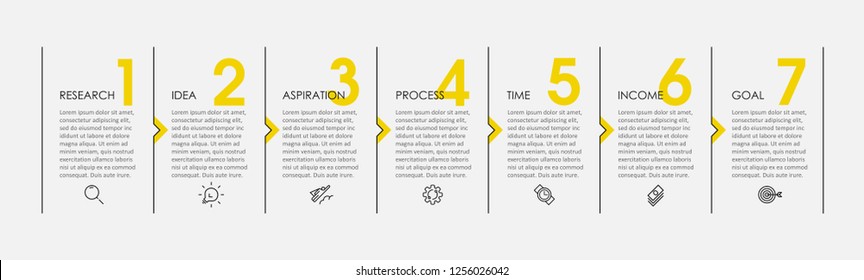
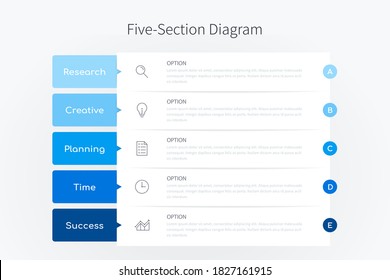
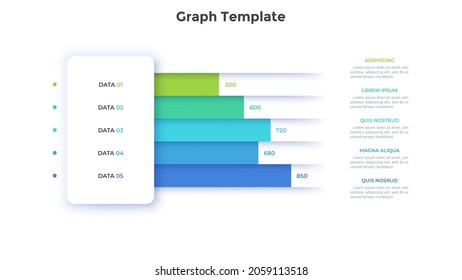
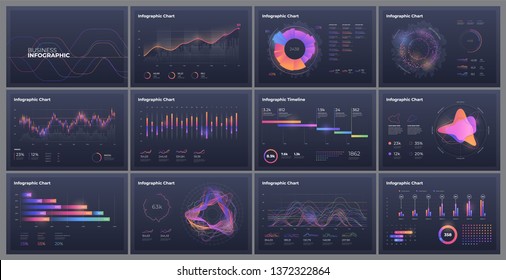
153 chart infographic designs graphics for t-shirt and print on demand merch
Download chart infographic t-shirt designs and other merch graphics like book covers, phone cases, tote bags and more.
Sort by
Most relevant
Sponsored results by
Get 15% off with code: VEXELS15
Show more
Colorful balloons infographic diagram PNG Design
Choose a folder
All favorites
Create new
Save
Colorful balloons infographic diagram PNG Design
Premium
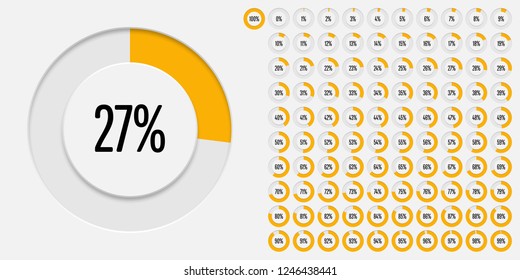
Infographic 100 percent doodle PNG Design
Choose a folder
All favorites
Create new
Save
Infographic 100 percent doodle PNG Design
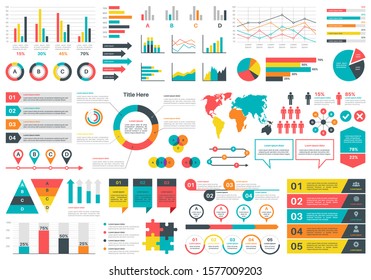
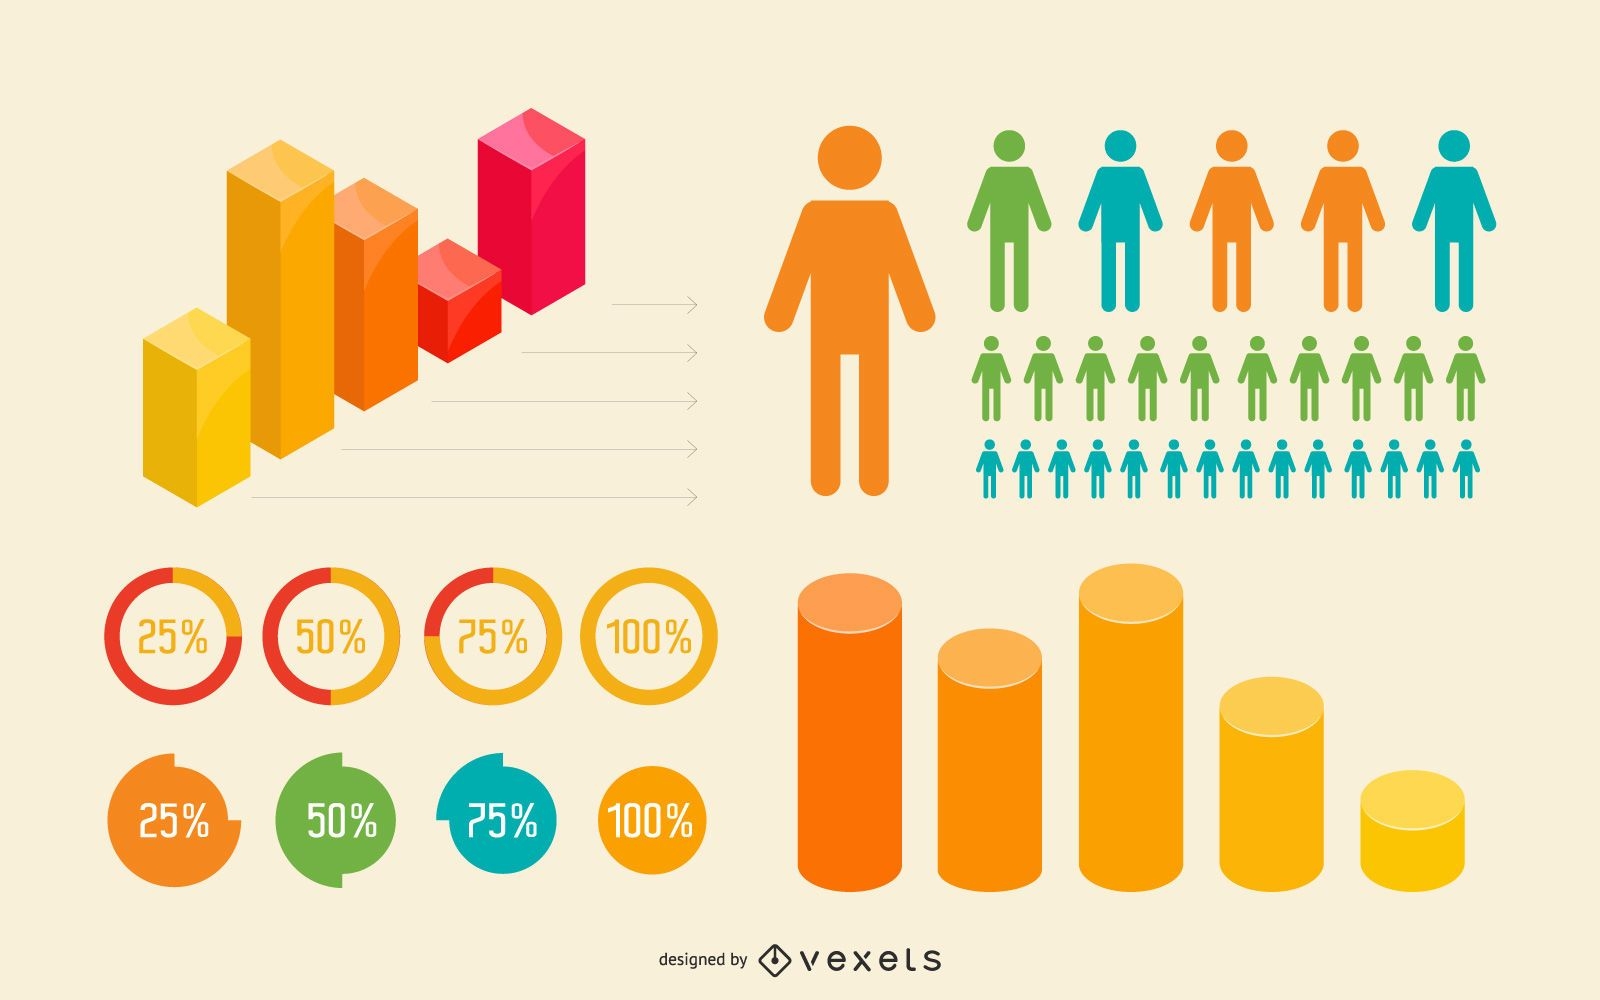
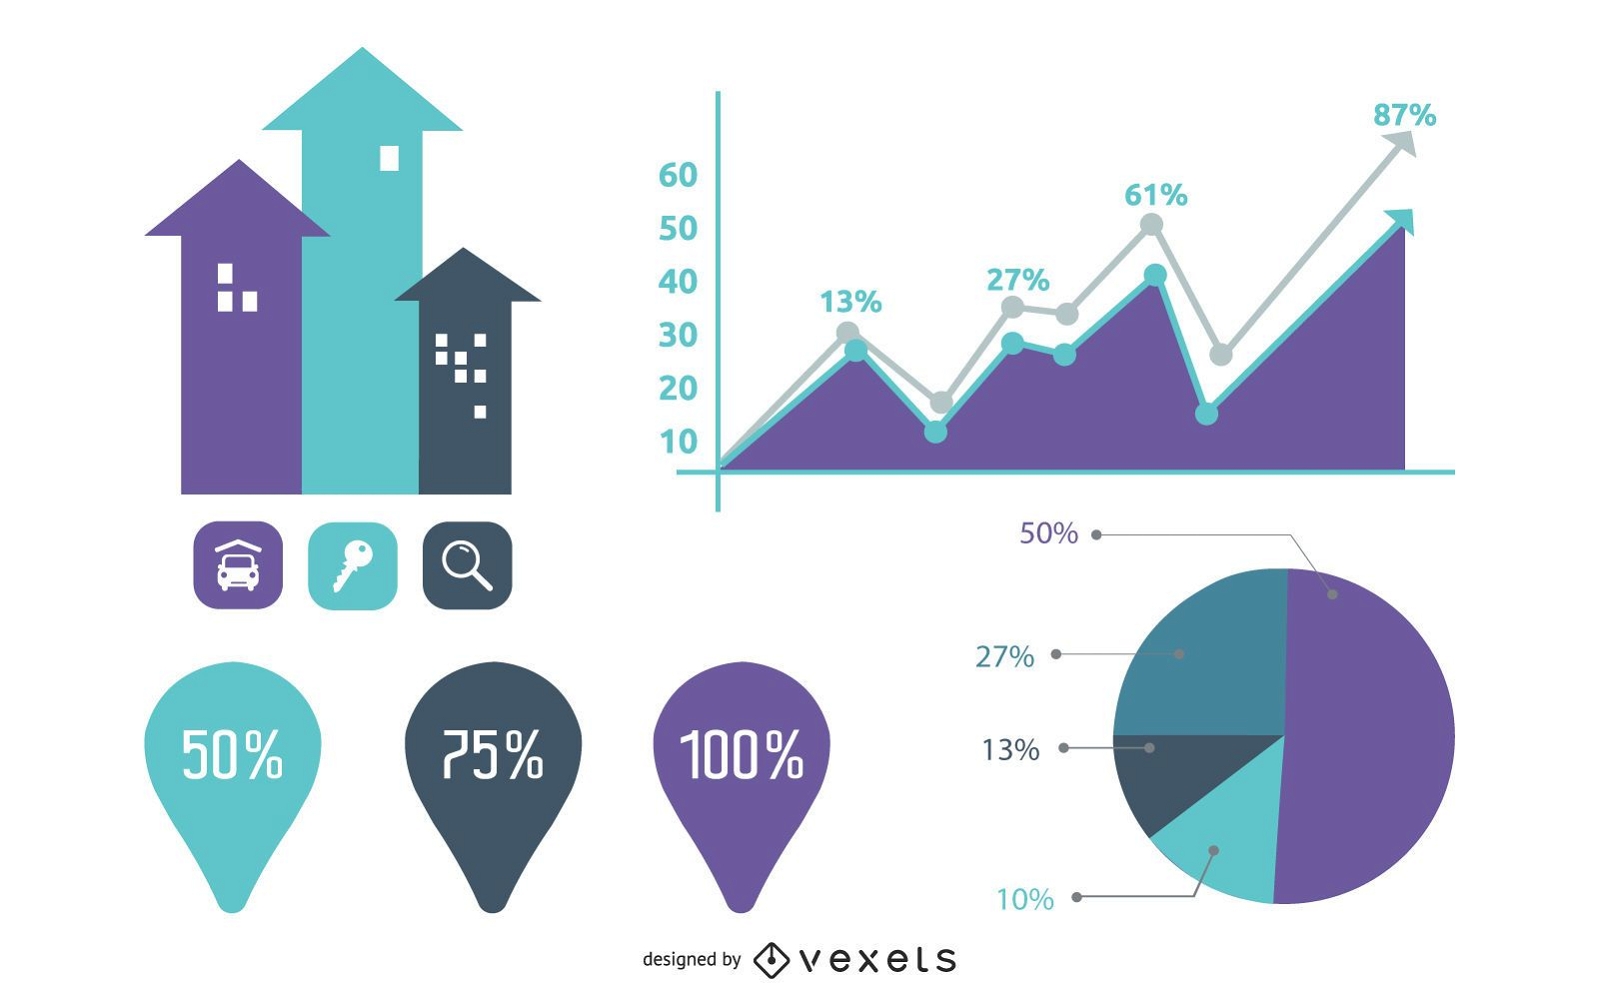
Flat & 3D Colorful Infographic Set
Choose a folder
All favorites
Create new
Save
Flat & 3D Colorful Infographic Set
Premium
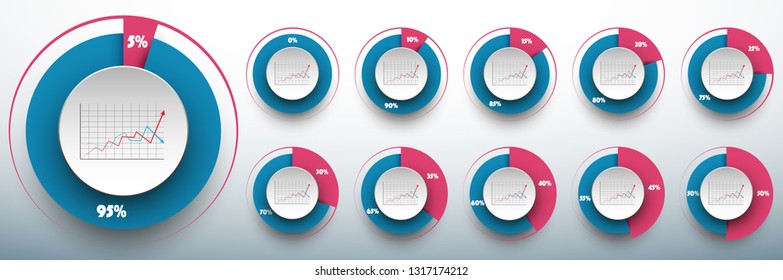
Infographic 75 percent doodle chart PNG Design
Choose a folder
All favorites
Create new
Save
Infographic 75 percent doodle chart PNG Design
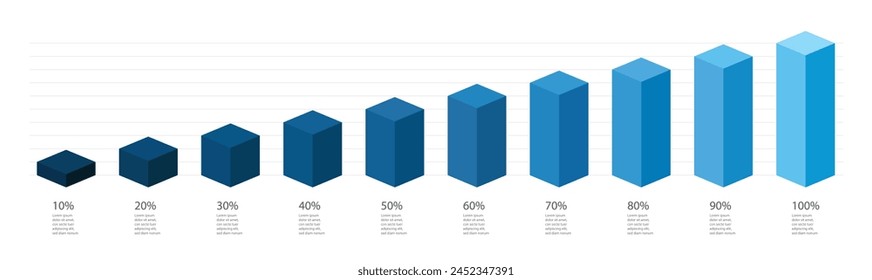
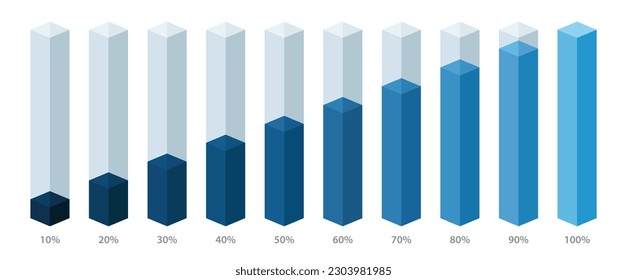
3d colorful pole chart PNG Design
Choose a folder
All favorites
Create new
Save
3d colorful pole chart PNG Design
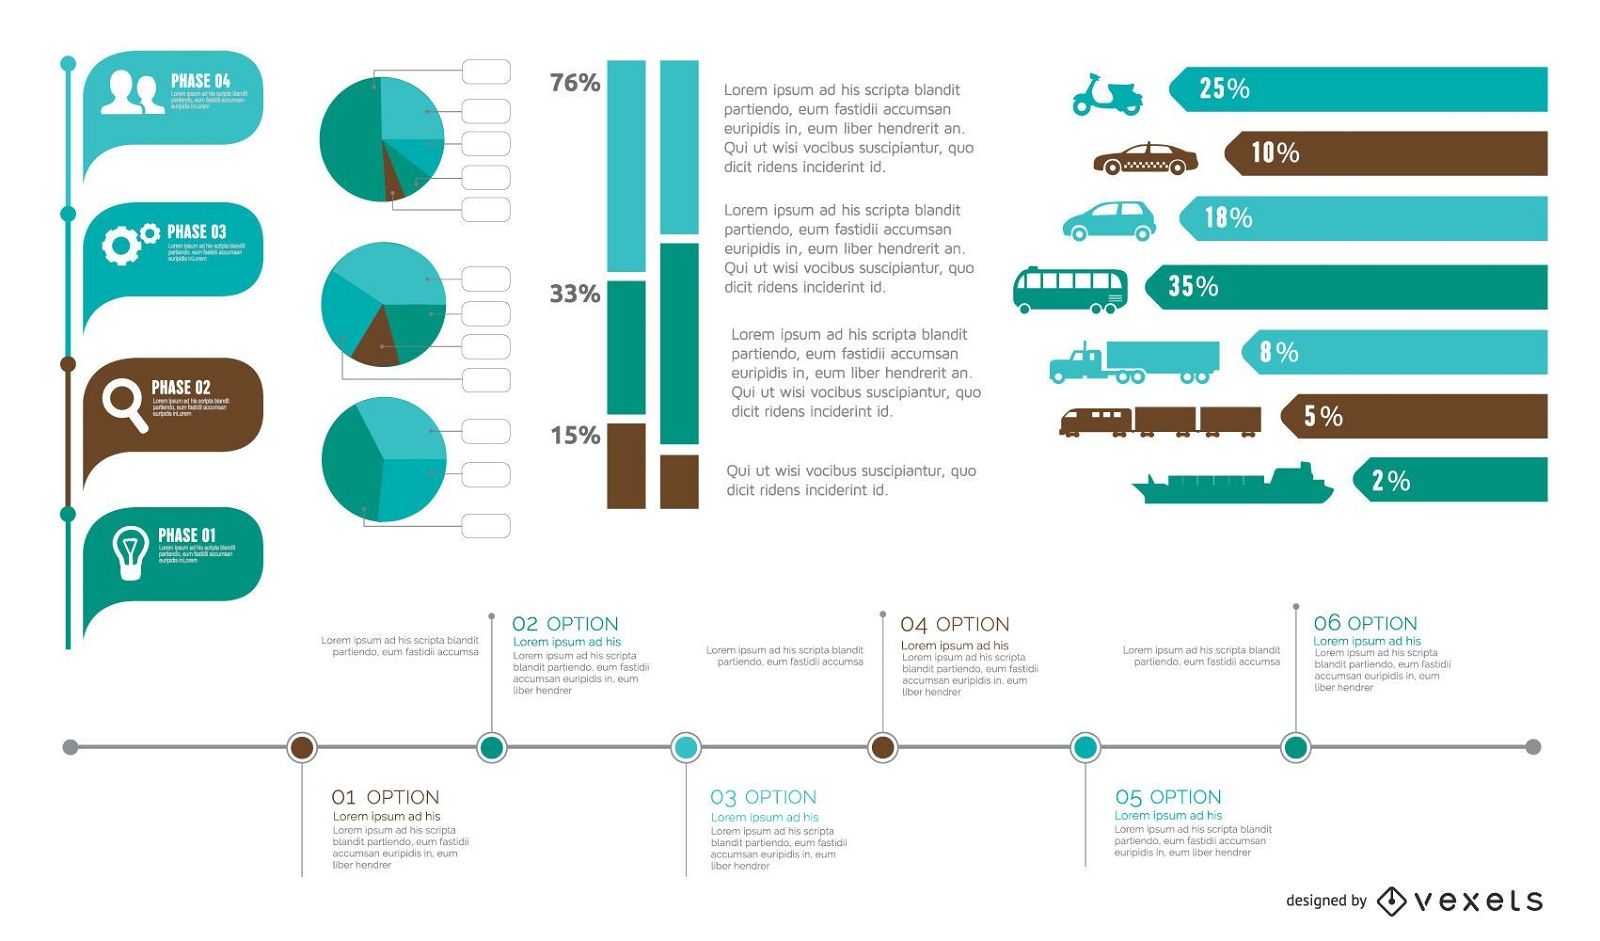
Transport & Trafic Infographic
Choose a folder
All favorites
Create new
Save
Transport & Trafic Infographic
Premium
25 percent doodle chart PNG Design
Choose a folder
All favorites
Create new
Save
25 percent doodle chart PNG Design
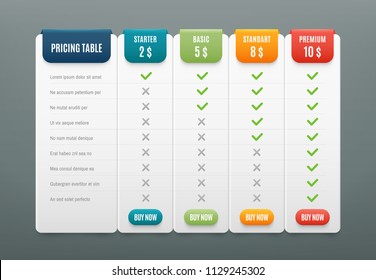
Classic Style Info Graphic Chart Pack
Choose a folder
All favorites
Create new
Save
Classic Style Info Graphic Chart Pack
Premium
Bar chart PNG Design
Choose a folder
All favorites
Create new
Save
Bar chart PNG Design
Premium
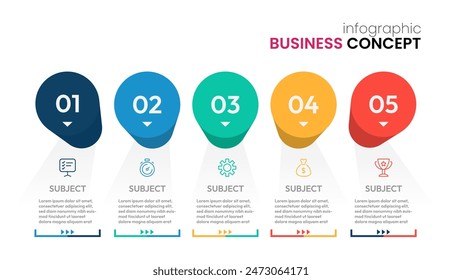
Multistage round icons infographic PNG Design
Choose a folder
All favorites
Create new
Save
Multistage round icons infographic PNG Design
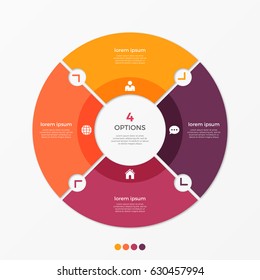
Colorful four parts pie chart PNG Design
Choose a folder
All favorites
Create new
Save
Colorful four parts pie chart PNG Design
Premium
Pilling up cubes chart PNG Design
Choose a folder
All favorites
Create new
Save
Pilling up cubes chart PNG Design
Premium
Flat colorful pie chart PNG Design
Choose a folder
All favorites
Create new
Save
Flat colorful pie chart PNG Design
Bar graph infographic 5 PNG Design
Choose a folder
All favorites
Create new
Save
Bar graph infographic 5 PNG Design
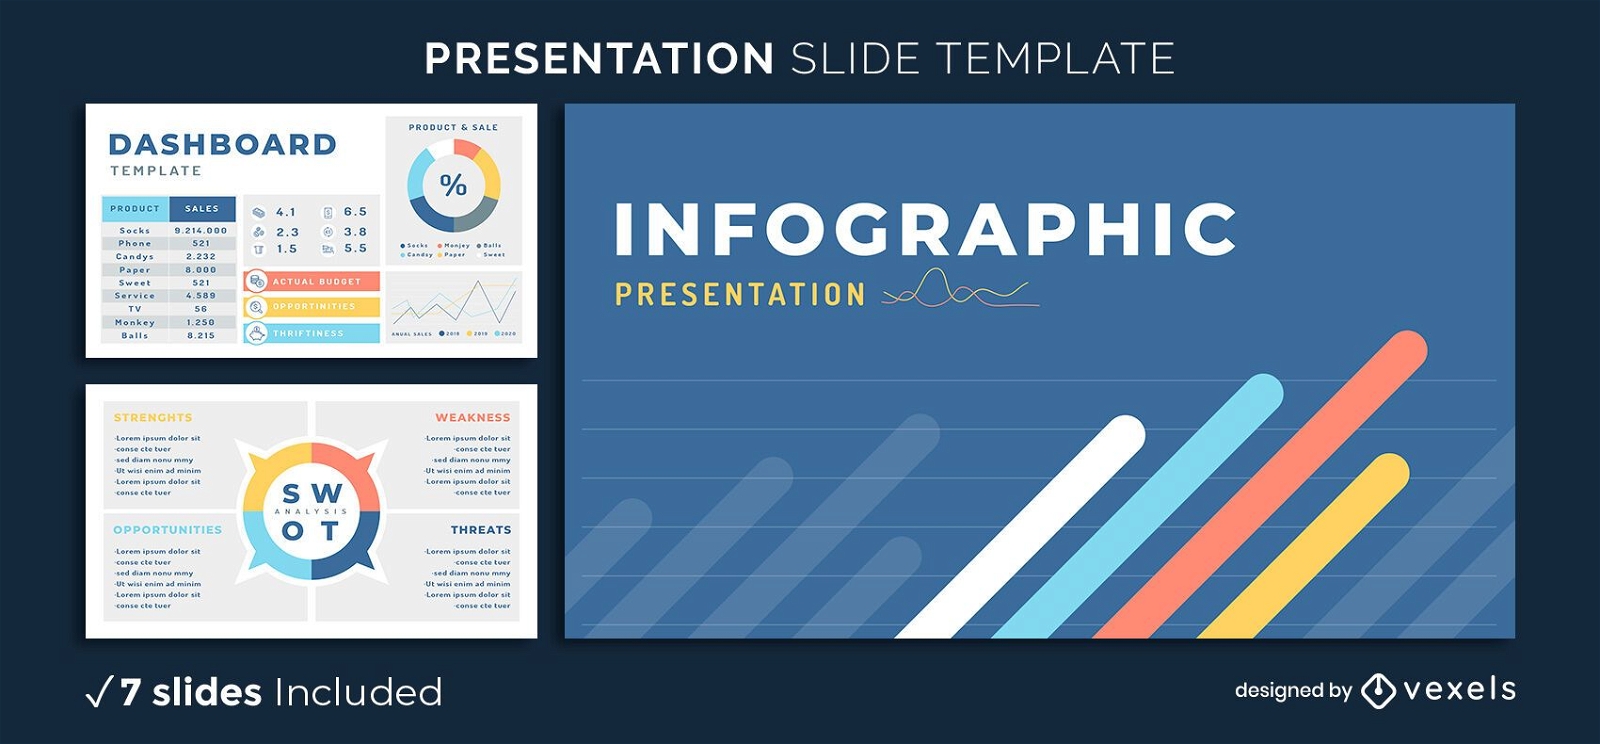
Editable Slides
Premium
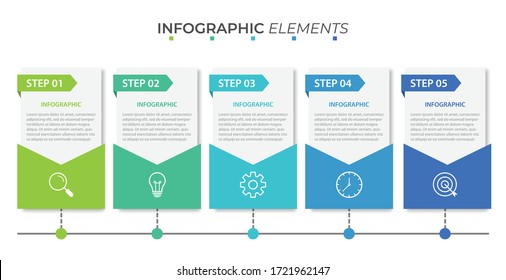
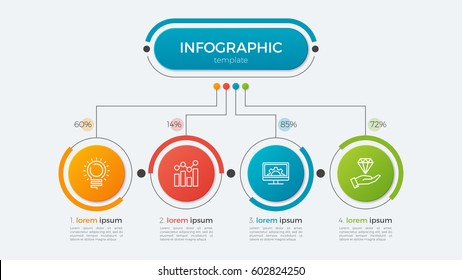
Infographic Elements Presentation Template
Choose a folder
All favorites
Create new
Save
Infographic Elements Presentation Template
Premium
Pie chart with arrows PNG Design
Choose a folder
All favorites
Create new
Save
Pie chart with arrows PNG Design
Double graph linechart infographic PNG Design
Choose a folder
All favorites
Create new
Save
Double graph linechart infographic PNG Design
Premium
Pie chart arrow PNG Design
Choose a folder
All favorites
Create new
Save
Pie chart arrow PNG Design
Premium
Hand drawn pie chart PNG Design
Choose a folder
All favorites
Create new
Save
Hand drawn pie chart PNG Design
Premium
Growing graph elliptical label infographic PNG Design
Choose a folder
All favorites
Create new
Save
Growing graph elliptical label infographic PNG Design
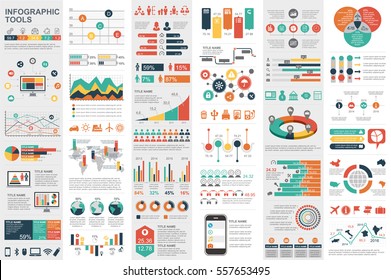
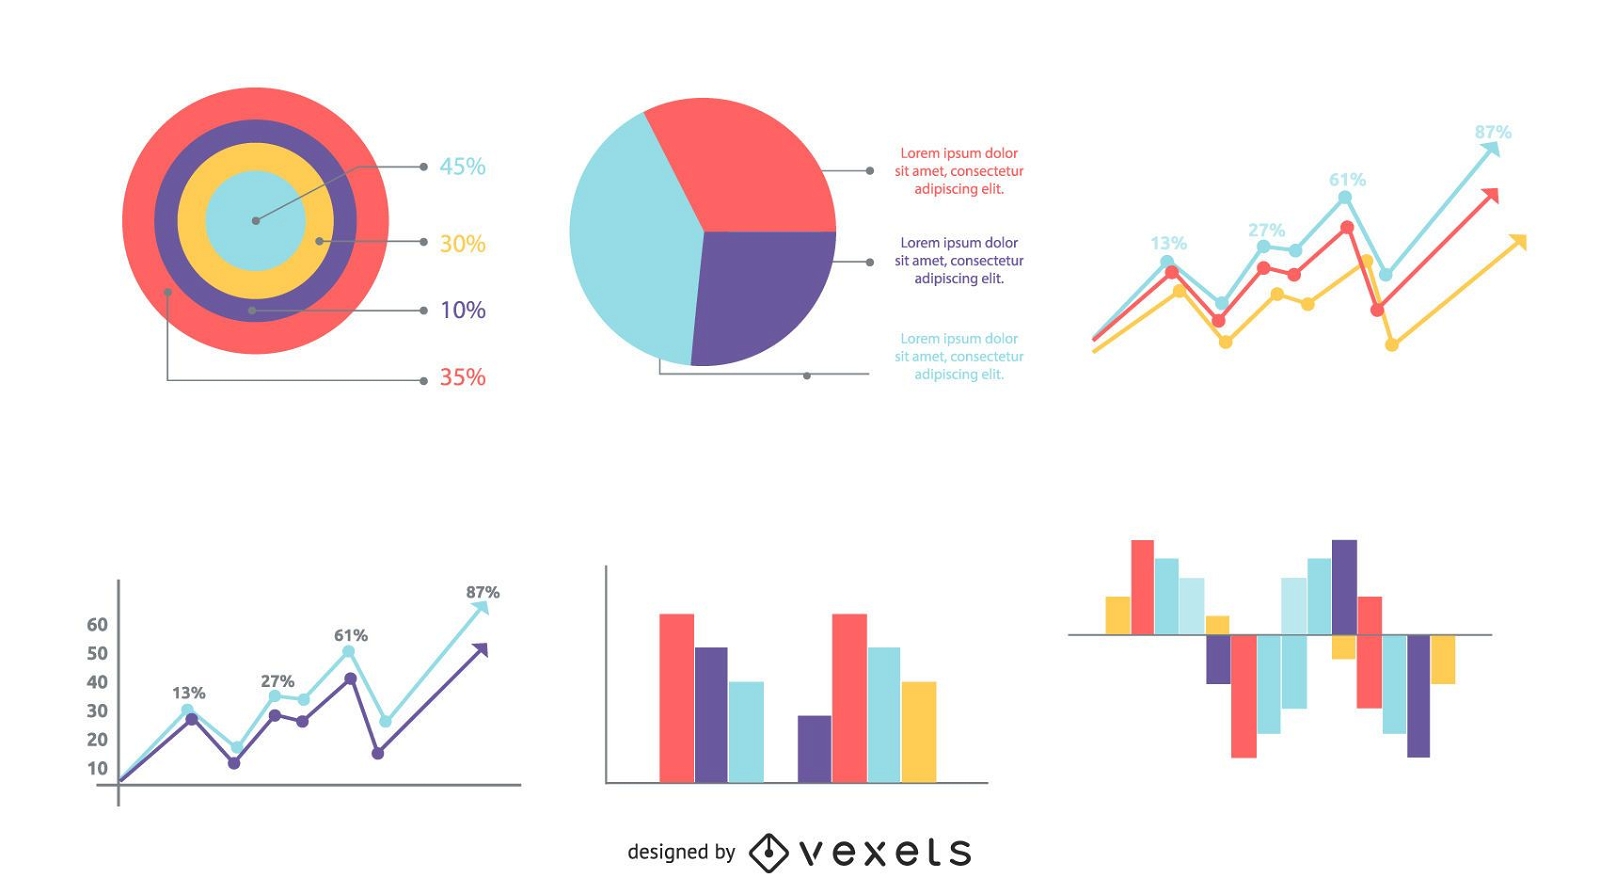
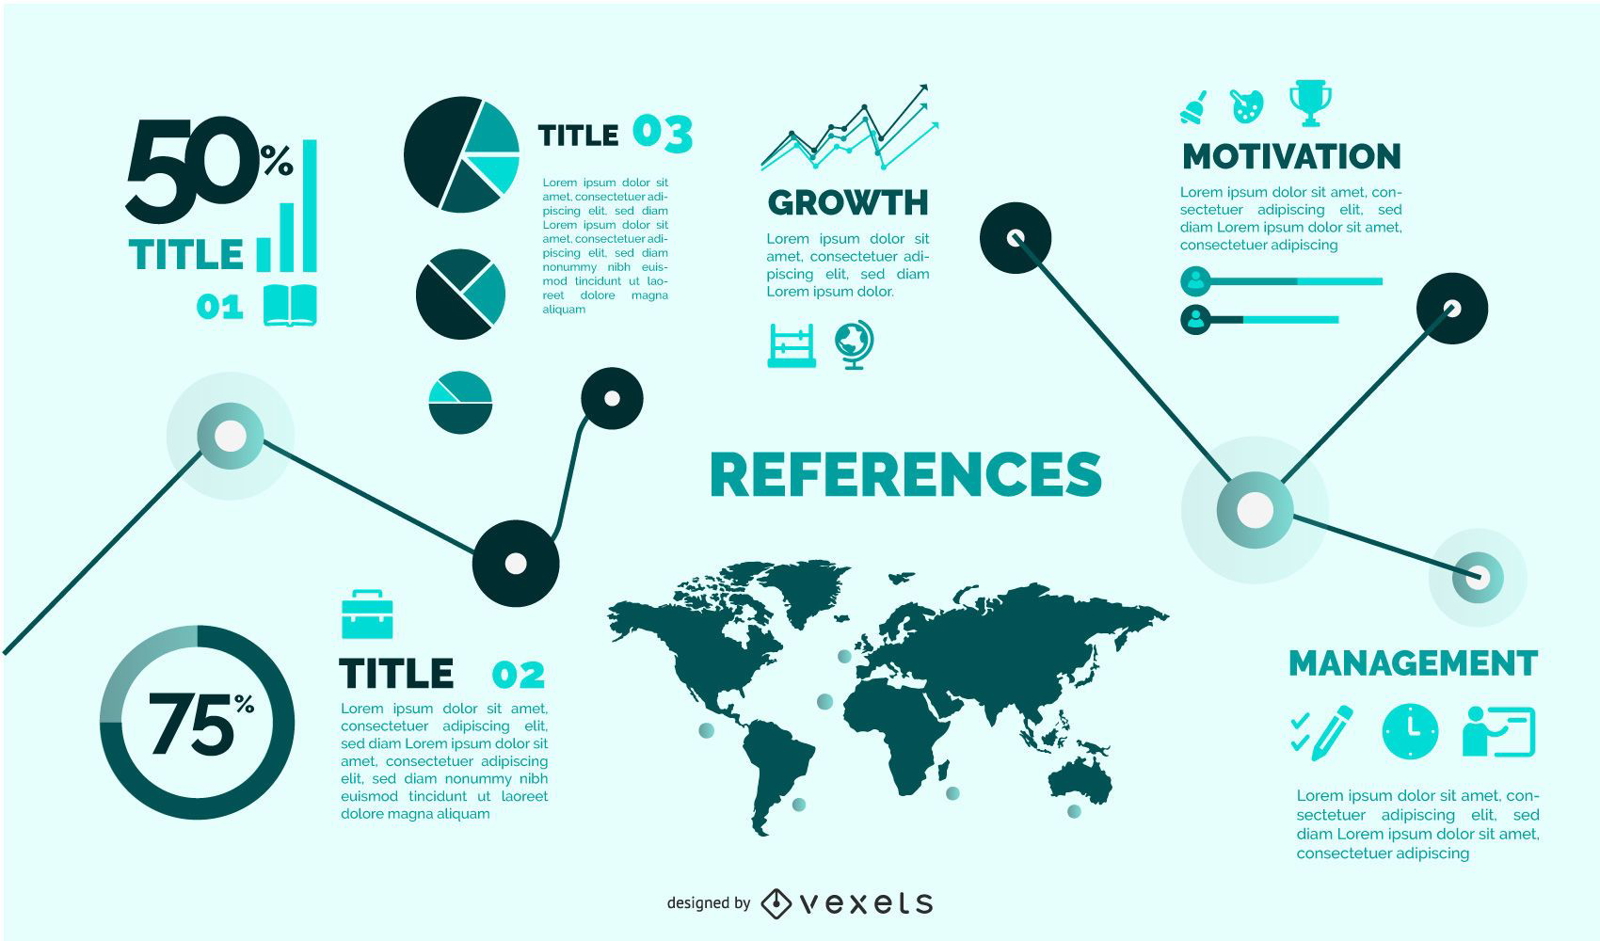
Statistic & Analytical Infographic Set
Choose a folder
All favorites
Create new
Save
Statistic & Analytical Infographic Set
Premium
Colorful arrow pie chart PNG Design
Choose a folder
All favorites
Create new
Save
Colorful arrow pie chart PNG Design
Premium
Colorful bars chart 6 PNG Design
Choose a folder
All favorites
Create new
Save
Colorful bars chart 6 PNG Design
Premium
Flat piechart infographic PNG Design
Choose a folder
All favorites
Create new
Save
Flat piechart infographic PNG Design
Premium
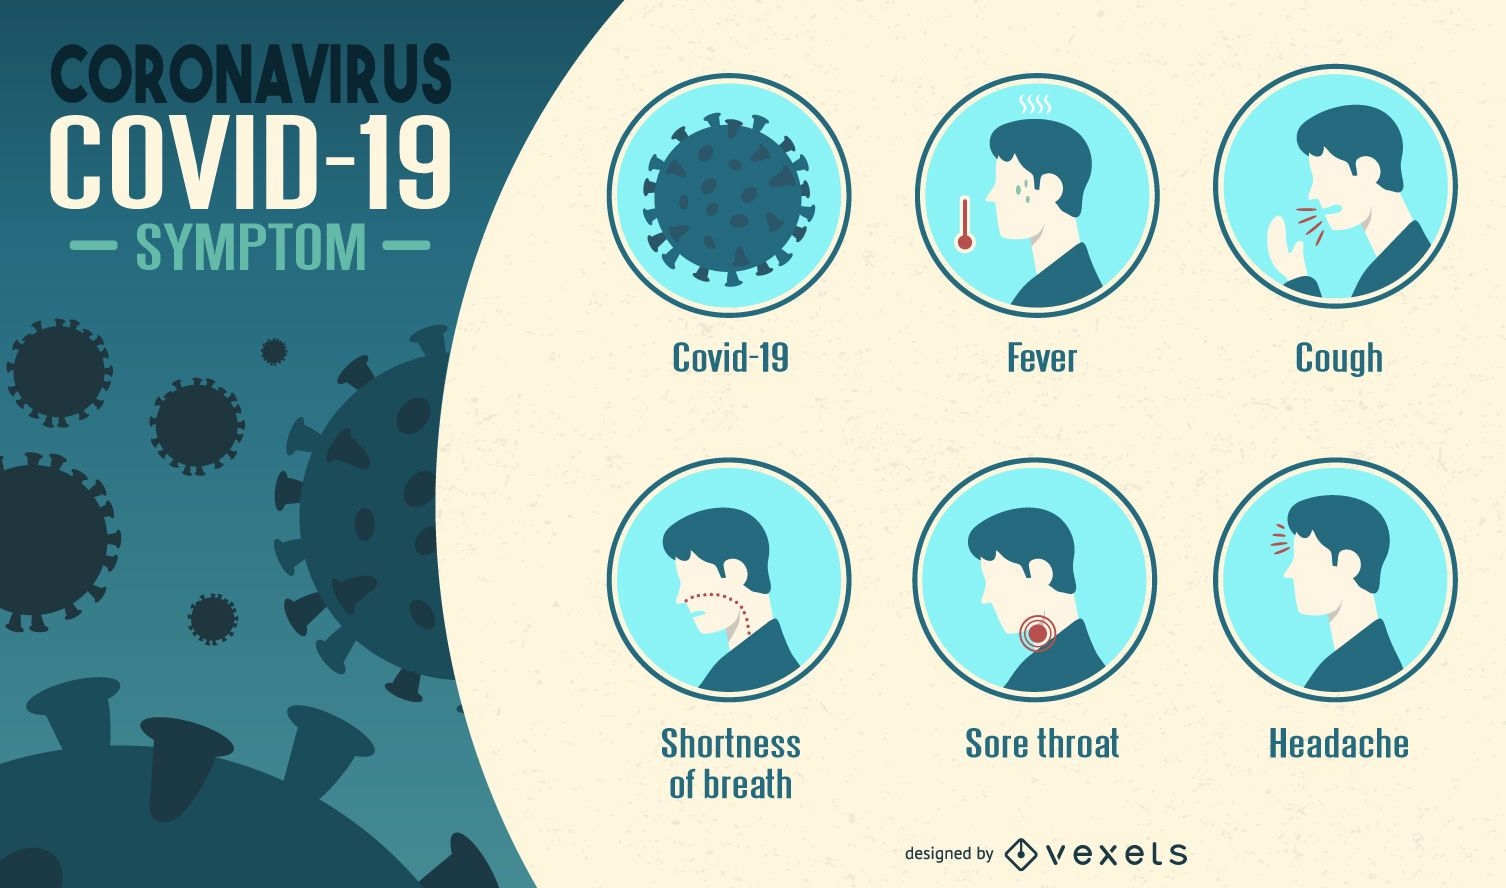
Coronavirus symptoms infographic
Choose a folder
All favorites
Create new
Save
Coronavirus symptoms infographic
Premium
Blue pie chart 1 PNG Design
Choose a folder
All favorites
Create new
Save
Blue pie chart 1 PNG Design
Premium
Graph elliptical sticker infographic PNG Design
Choose a folder
All favorites
Create new
Save
Graph elliptical sticker infographic PNG Design
Premium
Red blue circles chart PNG Design
Choose a folder
All favorites
Create new
Save
Red blue circles chart PNG Design
Premium
Doodle pie chart PNG Design
Choose a folder
All favorites
Create new
Save
Doodle pie chart PNG Design
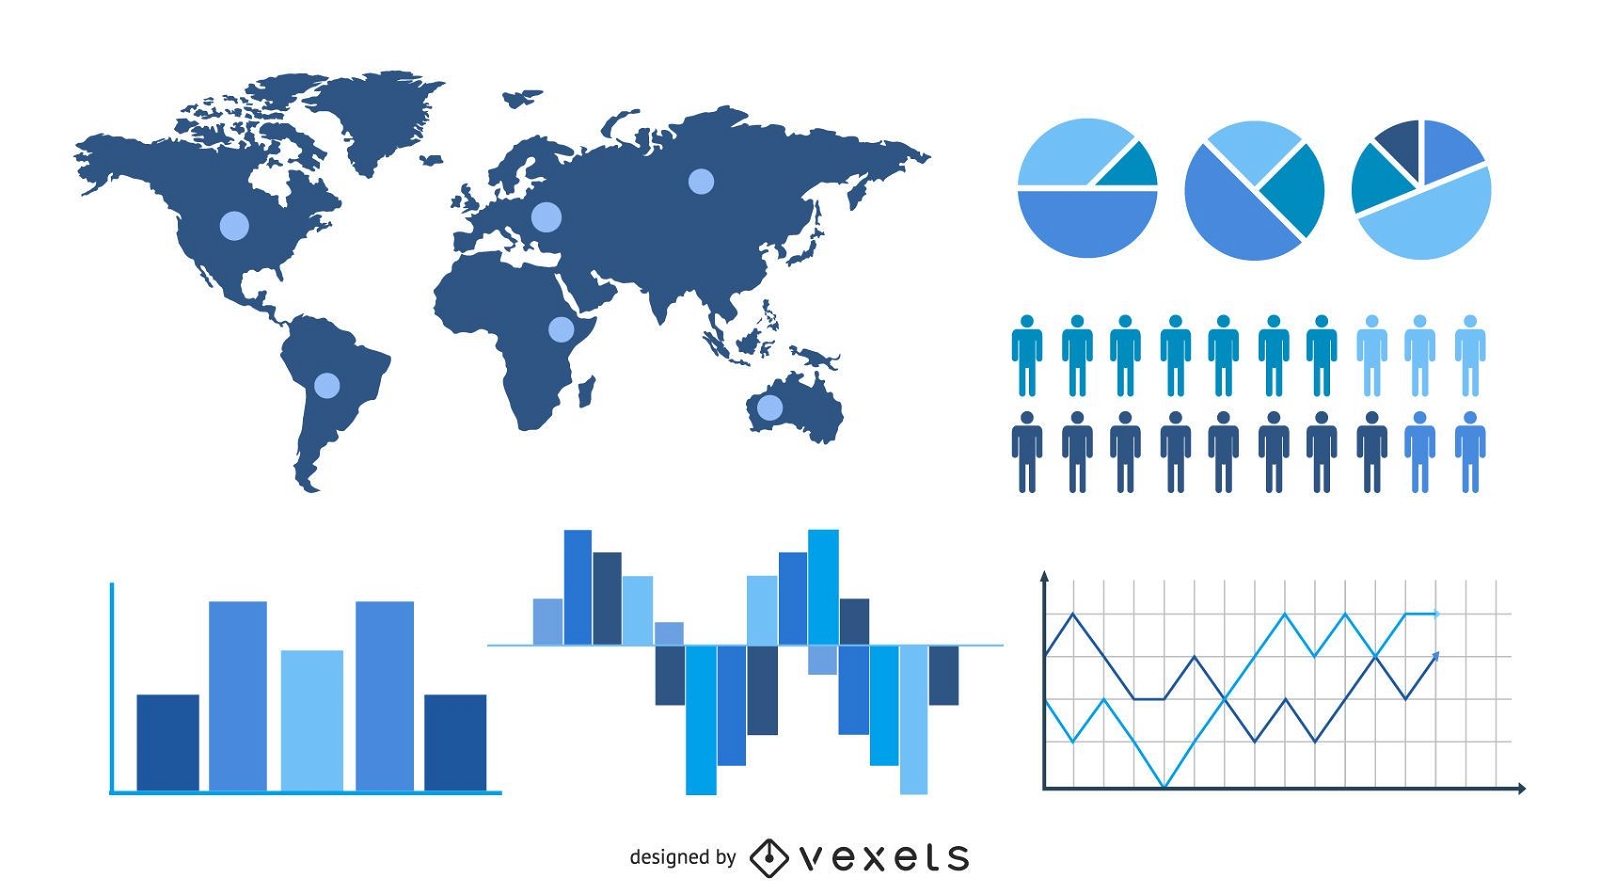
Colorful Infographic Element Pack in Flat Style
Choose a folder
All favorites
Create new
Save
Colorful Infographic Element Pack in Flat Style
Premium
Orange pie chart PNG Design
Choose a folder
All favorites
Create new
Save
Orange pie chart PNG Design
Vintage Info-Graphic Chart
Choose a folder
All favorites
Create new
Save
Vintage Info-Graphic Chart
Premium
Flat multicolor decreasing bar chart PNG Design
Choose a folder
All favorites
Create new
Save
Flat multicolor decreasing bar chart PNG Design
Premium
3 parts pie chart PNG Design
Choose a folder
All favorites
Create new
Save
3 parts pie chart PNG Design
Premium
Purple pie chart PNG Design
Choose a folder
All favorites
Create new
Save
Purple pie chart PNG Design
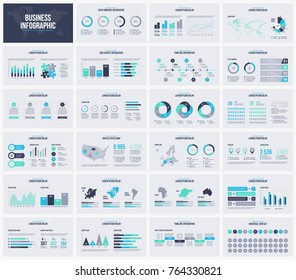
Flat Style Template Infographic Set
Choose a folder
All favorites
Create new
Save
Flat Style Template Infographic Set
Money chart flat icon PNG Design
Choose a folder
All favorites
Create new
Save
Money chart flat icon PNG Design
Money chart stroke icon PNG Design
Choose a folder
All favorites
Create new
Save
Money chart stroke icon PNG Design
Premium
Green red rhomb chart PNG Design
Choose a folder
All favorites
Create new
Save
Green red rhomb chart PNG Design
Premium
Blue orange circles chart PNG Design
Choose a folder
All favorites
Create new
Save
Blue orange circles chart PNG Design
Premium
Blue pie chart PNG Design
Choose a folder
All favorites
Create new
Save
Blue pie chart PNG Design
Premium
Graph square infographic sticker PNG Design
Choose a folder
All favorites
Create new
Save
Graph square infographic sticker PNG Design
Blue grey orange pie chart PNG Design
Choose a folder
All favorites
Create new
Save
Blue grey orange pie chart PNG Design
4 parts piechart infographic PNG Design
Choose a folder
All favorites
Create new
Save
4 parts piechart infographic PNG Design
Premium
Multicolor rounded edge bar chart PNG Design
Choose a folder
All favorites
Create new
Save
Multicolor rounded edge bar chart PNG Design
Premium
Three parts pie chart PNG Design
Choose a folder
All favorites
Create new
Save
Three parts pie chart PNG Design
Bauble christmas pie chart PNG Design
Choose a folder
All favorites
Create new
Save
Bauble christmas pie chart PNG Design
Premium
Two parts bars chart 3 PNG Design
Choose a folder
All favorites
Create new
Save
Two parts bars chart 3 PNG Design
Premium
Orange green circles chart PNG Design
Choose a folder
All favorites
Create new
Save
Orange green circles chart PNG Design
Premium
Golden pie chart PNG Design
Choose a folder
All favorites
Create new
Save
Golden pie chart PNG Design
Boost Your Business
With The Leading Graphic Platform For Merch.
SEE PLANS
Next
of 4
prev page
next page