Design Library
Explore Designs
New Merch Designs
Trending Merch Designs
Vectors
PNGs & SVGs
Mockups
T-Shirts
T-Shirt PSD Templates
KDP Designs
Phone Cases
Pillows
Tote Bags
Posters
Mugs
Design Tools
Designer
New!
T-shirt Maker
Mockup Generator
Quote Generator
Logo Maker
Resources
Merch Digest
Blog
Help Center
Creators Program
Learn About Merch
Changelog
Pricing
Loading...
Sign Up
Login
All
chart
Design Library
Explore Designs
New Merch Designs
Trending Merch Designs
Vectors
PNGs & SVGs
Mockups
T-Shirts
T-Shirt PSD Templates
KDP Designs
Phone Cases
Pillows
Tote Bags
Posters
Mugs
Design Tools
Designer
New!
T-shirt Maker
Mockup Generator
Quote Generator
Logo Maker
Resources
Merch Digest
Blog
Help Center
Creators Program
Learn About Merch
Changelog
PLANS
All
chart
511 chart designs graphics for t-shirt and print on demand merch
Download chart t-shirt designs and other merch graphics like book covers, phone cases, tote bags and more.
Related:
charts
,
pie chart
,
pie charts
Sort by
Most relevant
Sponsored results by
Get 15% off with code: VEXELS15
Show more
Premium
Golden pie chart PNG Design
Choose a folder
All favorites
Create new
Save
Golden pie chart PNG Design
3 part pie chart PNG Design
Choose a folder
All favorites
Create new
Save
3 part pie chart PNG Design
Premium
Orange green circles chart PNG Design
Choose a folder
All favorites
Create new
Save
Orange green circles chart PNG Design
3 part chirstmas pie chart PNG Design
Choose a folder
All favorites
Create new
Save
3 part chirstmas pie chart PNG Design
Premium
Chart shape stroke PNG Design
Choose a folder
All favorites
Create new
Save
Chart shape stroke PNG Design
Pie chart hand drawn PNG Design
Choose a folder
All favorites
Create new
Save
Pie chart hand drawn PNG Design
Premium
Chart shape PNG Design
Choose a folder
All favorites
Create new
Save
Chart shape PNG Design
Premium
Rounded chart shape PNG Design
Choose a folder
All favorites
Create new
Save
Rounded chart shape PNG Design
Premium
Green pie chart PNG Design
Choose a folder
All favorites
Create new
Save
Green pie chart PNG Design
Premium
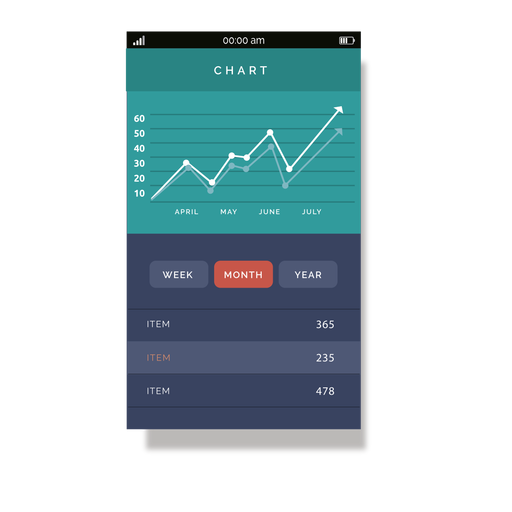
Green mobile chart interface PNG Design
Choose a folder
All favorites
Create new
Save
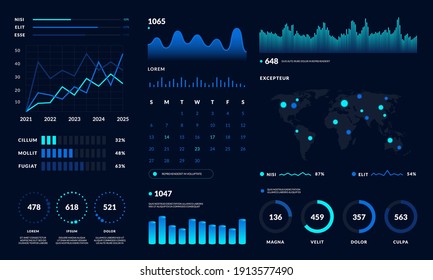
Green mobile chart interface PNG Design
Premium
Red pie chart PNG Design
Choose a folder
All favorites
Create new
Save
Red pie chart PNG Design
Premium
Tab with chart PNG Design
Choose a folder
All favorites
Create new
Save
Tab with chart PNG Design
Donut chart hand drawn PNG Design
Choose a folder
All favorites
Create new
Save
Donut chart hand drawn PNG Design
Premium
Blue orange rhomb chart PNG Design
Choose a folder
All favorites
Create new
Save
Blue orange rhomb chart PNG Design
Large 3d bar chart hand drawing PNG Design
Choose a folder
All favorites
Create new
Save
Large 3d bar chart hand drawing PNG Design
3d bar chart hand drawn PNG Design
Choose a folder
All favorites
Create new
Save
3d bar chart hand drawn PNG Design
Editable text
Print ready
for Merch
Astrological chart mystic t-shirt design
Choose a folder
All favorites
Create new
Save
Astrological chart mystic t-shirt design
Print ready
for Merch
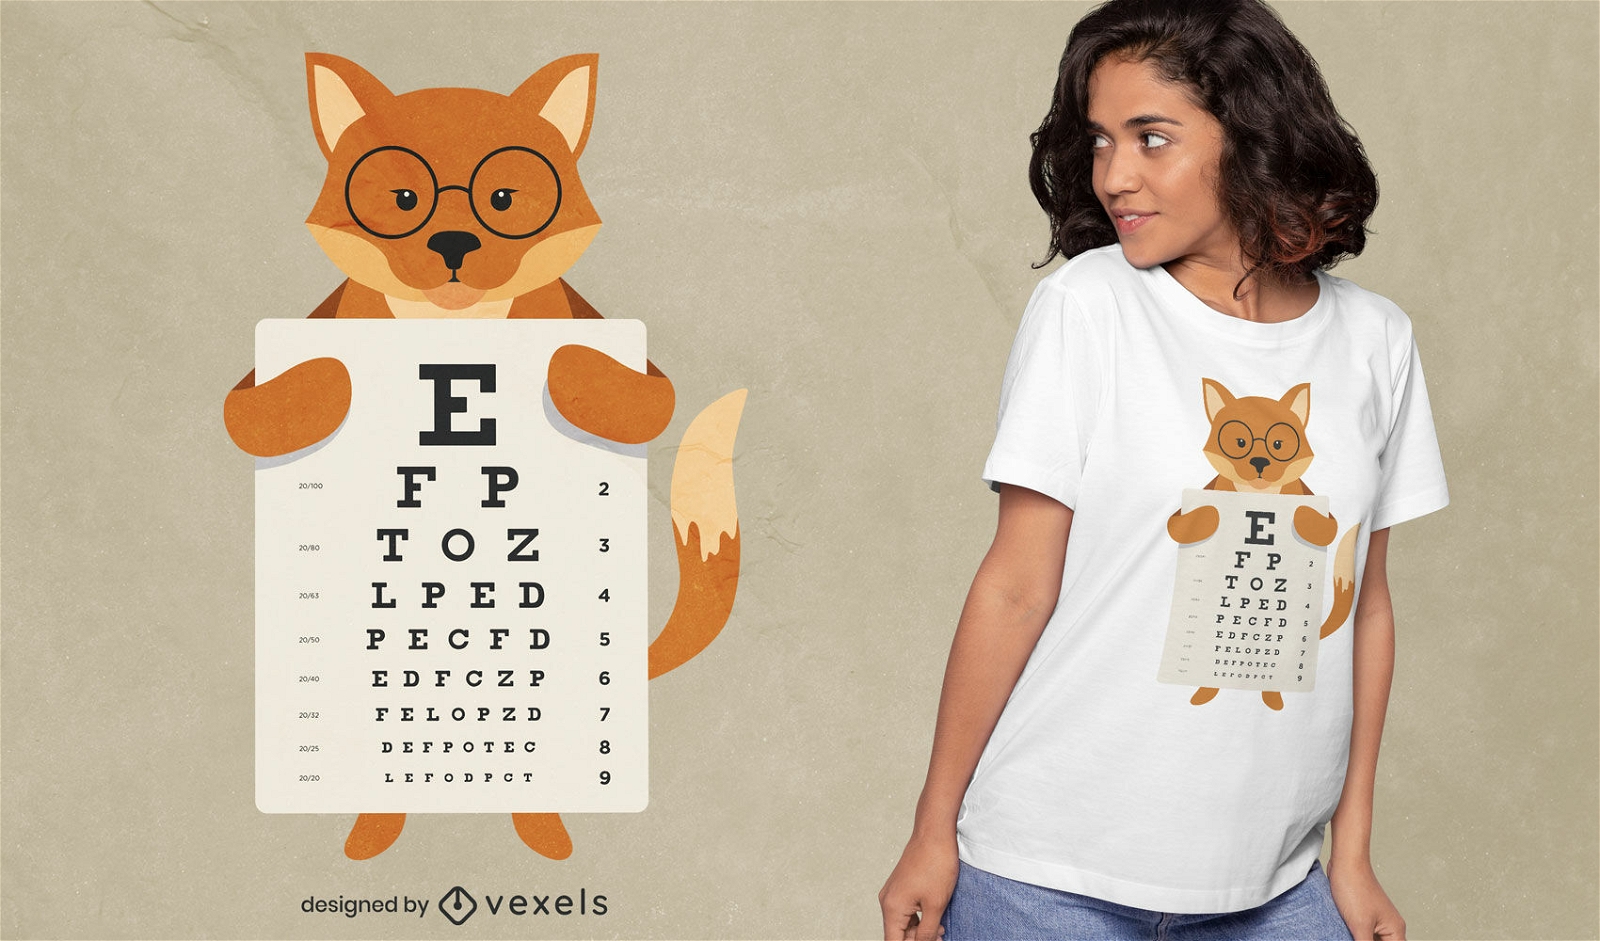
Animal fox eye chart t-shirt design
Choose a folder
All favorites
Create new
Save
Animal fox eye chart t-shirt design
Print ready
for Merch
Monkey evolution chart classroom t-shirt design
Choose a folder
All favorites
Create new
Save
Monkey evolution chart classroom t-shirt design
Print ready
for Merch
Llama holding eye chart t-shirt design
Choose a folder
All favorites
Create new
Save
Llama holding eye chart t-shirt design
for Merch
Horse eye chart t-shirt design
Choose a folder
All favorites
Create new
Save
Horse eye chart t-shirt design
for Merch
Pig eye chart t-shirt design
Choose a folder
All favorites
Create new
Save
Pig eye chart t-shirt design
Print ready
for Merch
Unicorn anatomy chart t-shirt design
Choose a folder
All favorites
Create new
Save
Unicorn anatomy chart t-shirt design
Editable text
Print ready
Premium
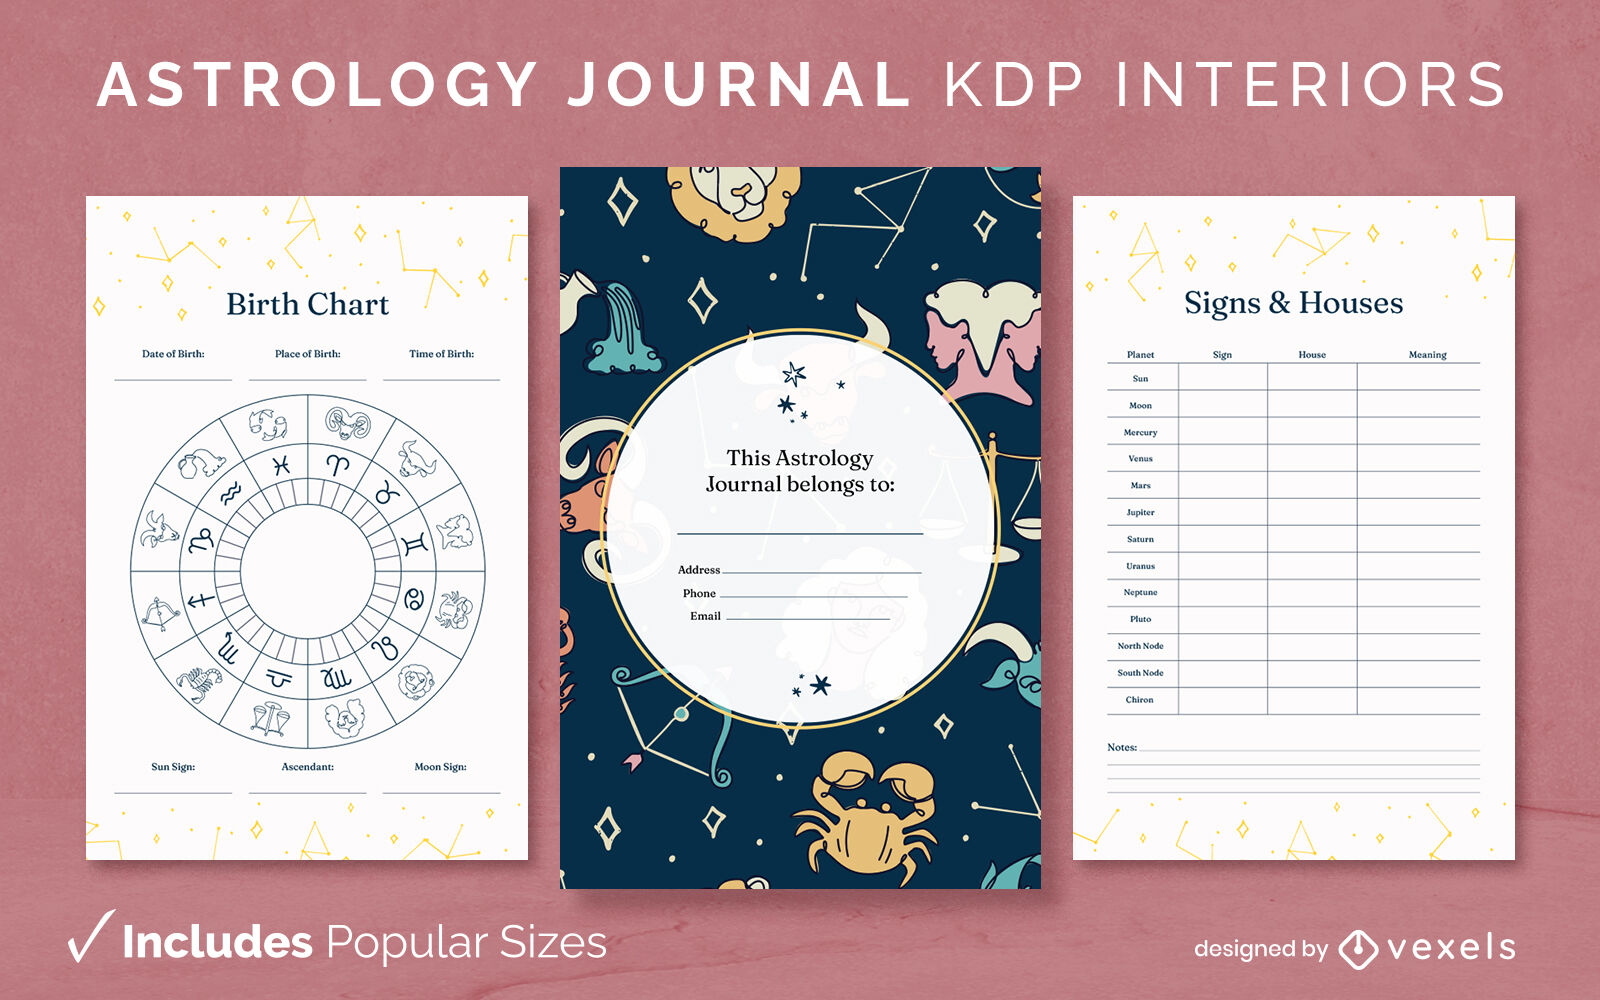
Astrology sun journal design template KDP
Choose a folder
All favorites
Create new
Save
Astrology sun journal design template KDP
Editable text
Print ready
Premium
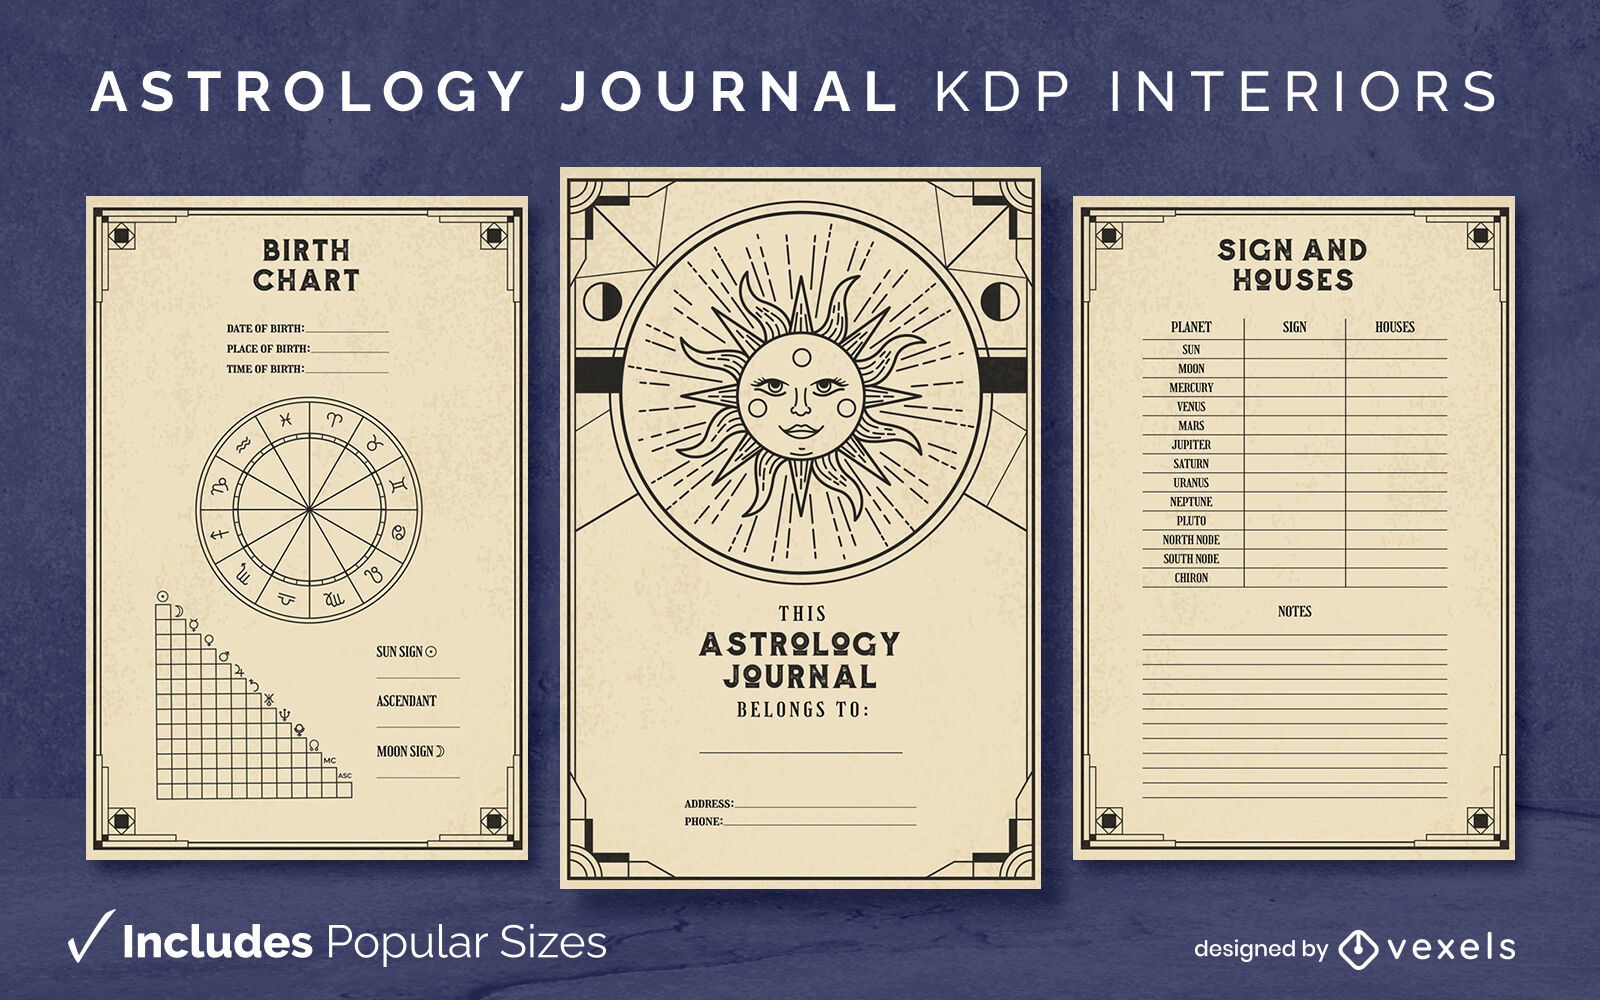
Astrology journal design template KDP
Choose a folder
All favorites
Create new
Save
Astrology journal design template KDP
Premium
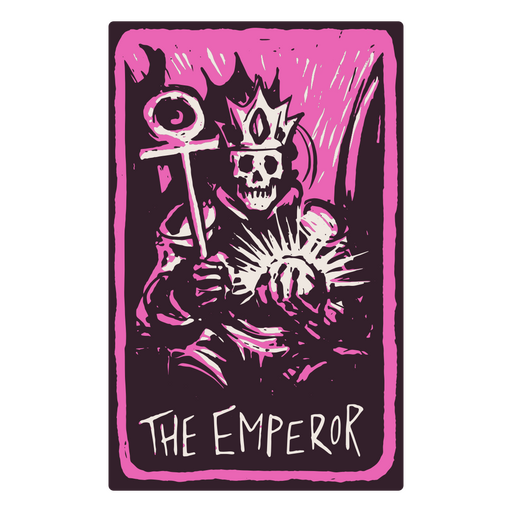
The Emperor card in a skeleton-themed tarot PNG Design
Choose a folder
All favorites
Create new
Save
The Emperor card in a skeleton-themed tarot PNG Design
Print ready
for Merch
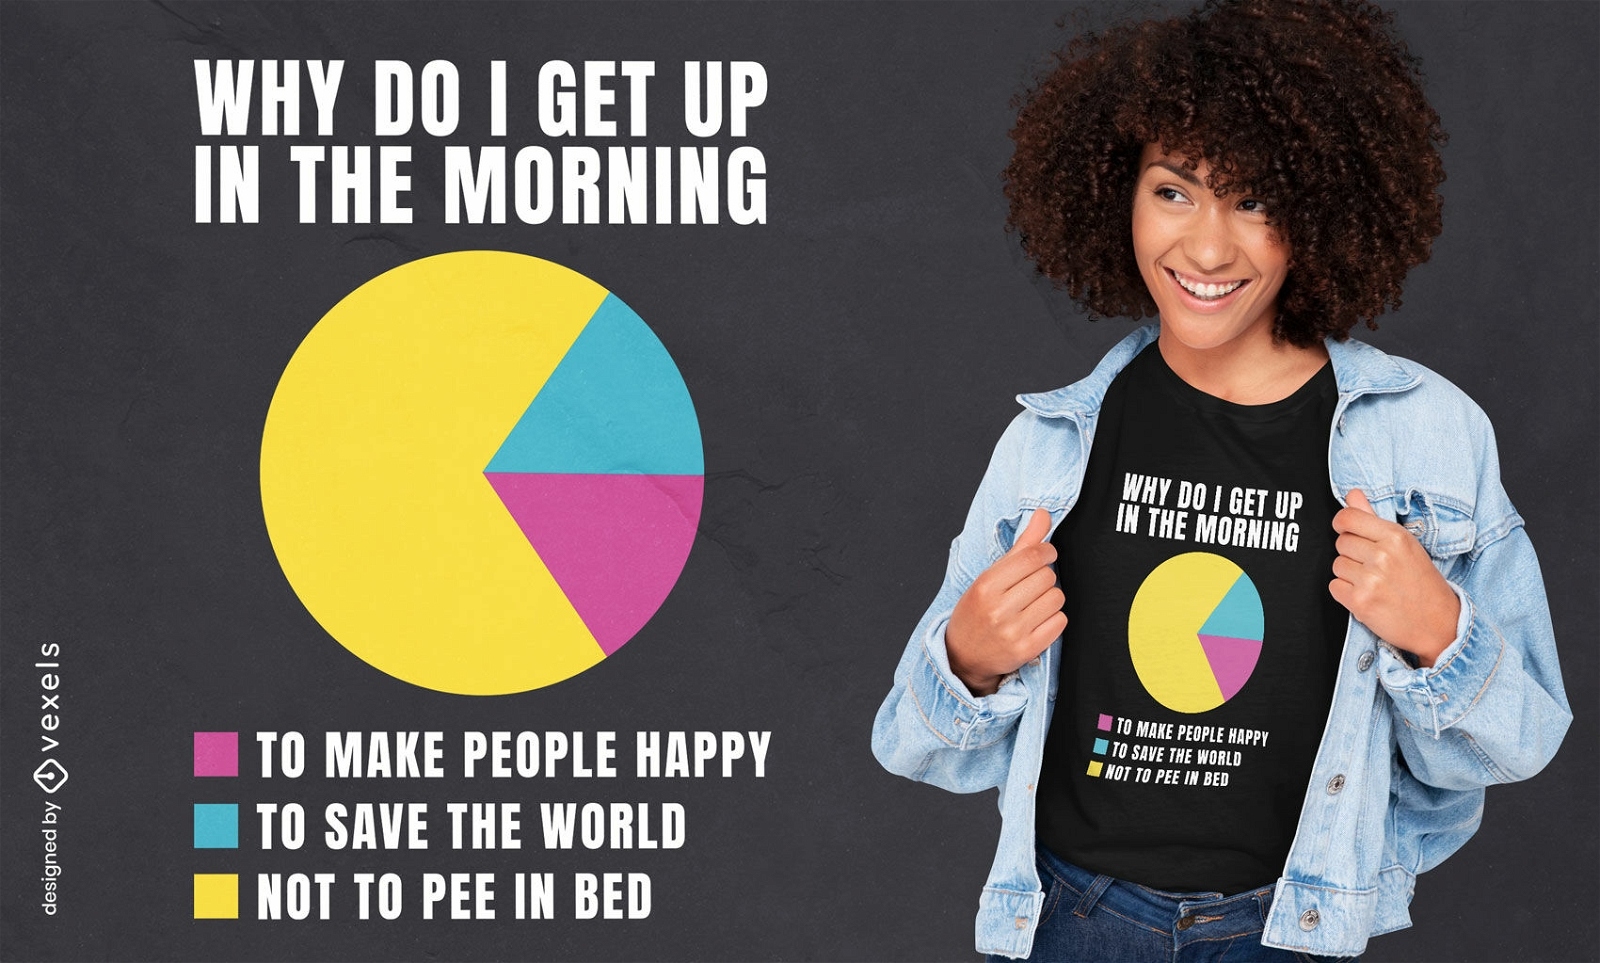
Get up quote t-shirt design
Choose a folder
All favorites
Create new
Save
Get up quote t-shirt design
Print ready
for Merch
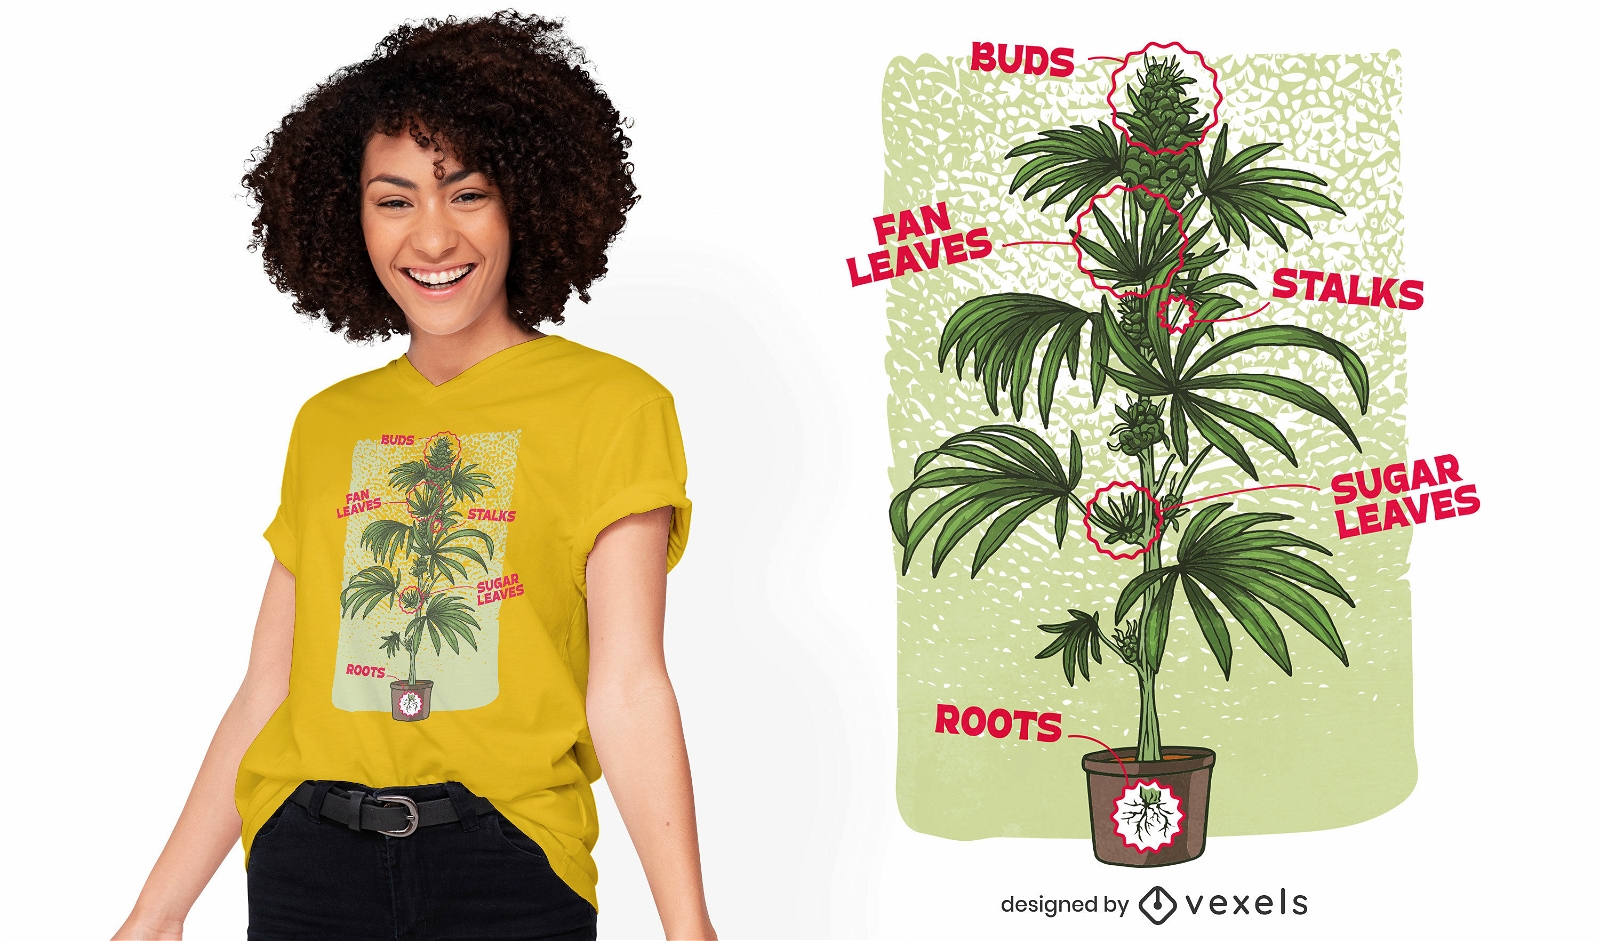
Cannabis plant chart nature t-shirt design
Choose a folder
All favorites
Create new
Save
Cannabis plant chart nature t-shirt design
Premium
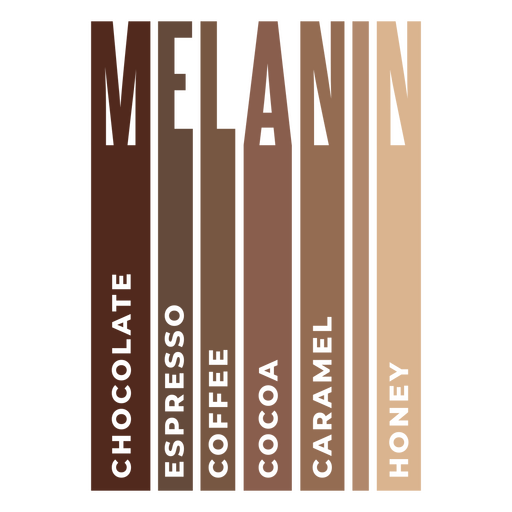
Melanin pantone chart PNG Design
Choose a folder
All favorites
Create new
Save
Melanin pantone chart PNG Design
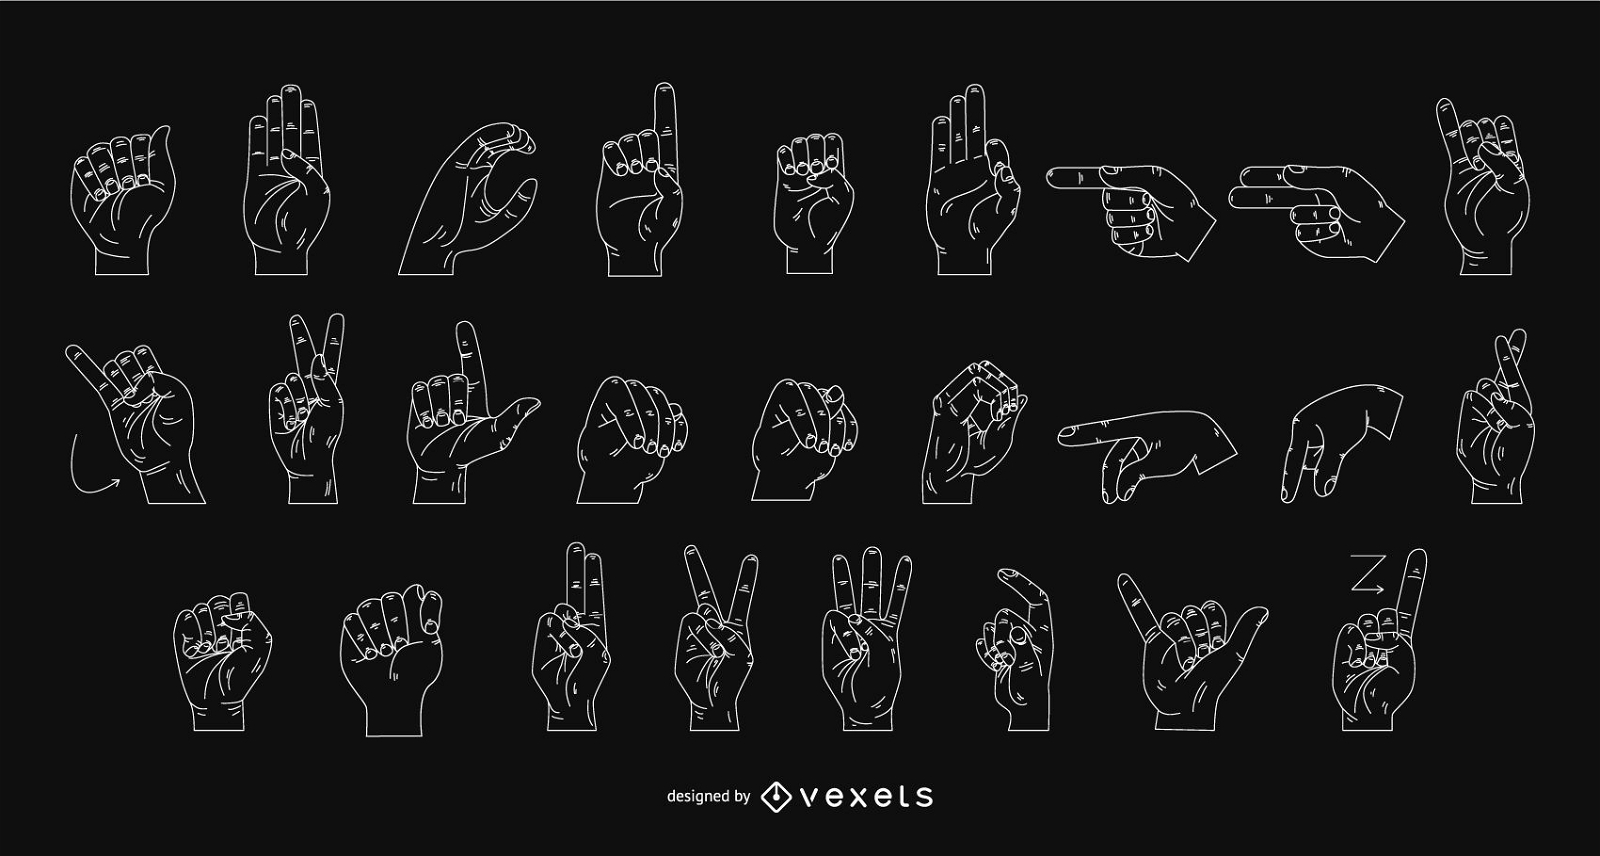
sign language chart design
Choose a folder
All favorites
Create new
Save
sign language chart design
Print ready
for Merch
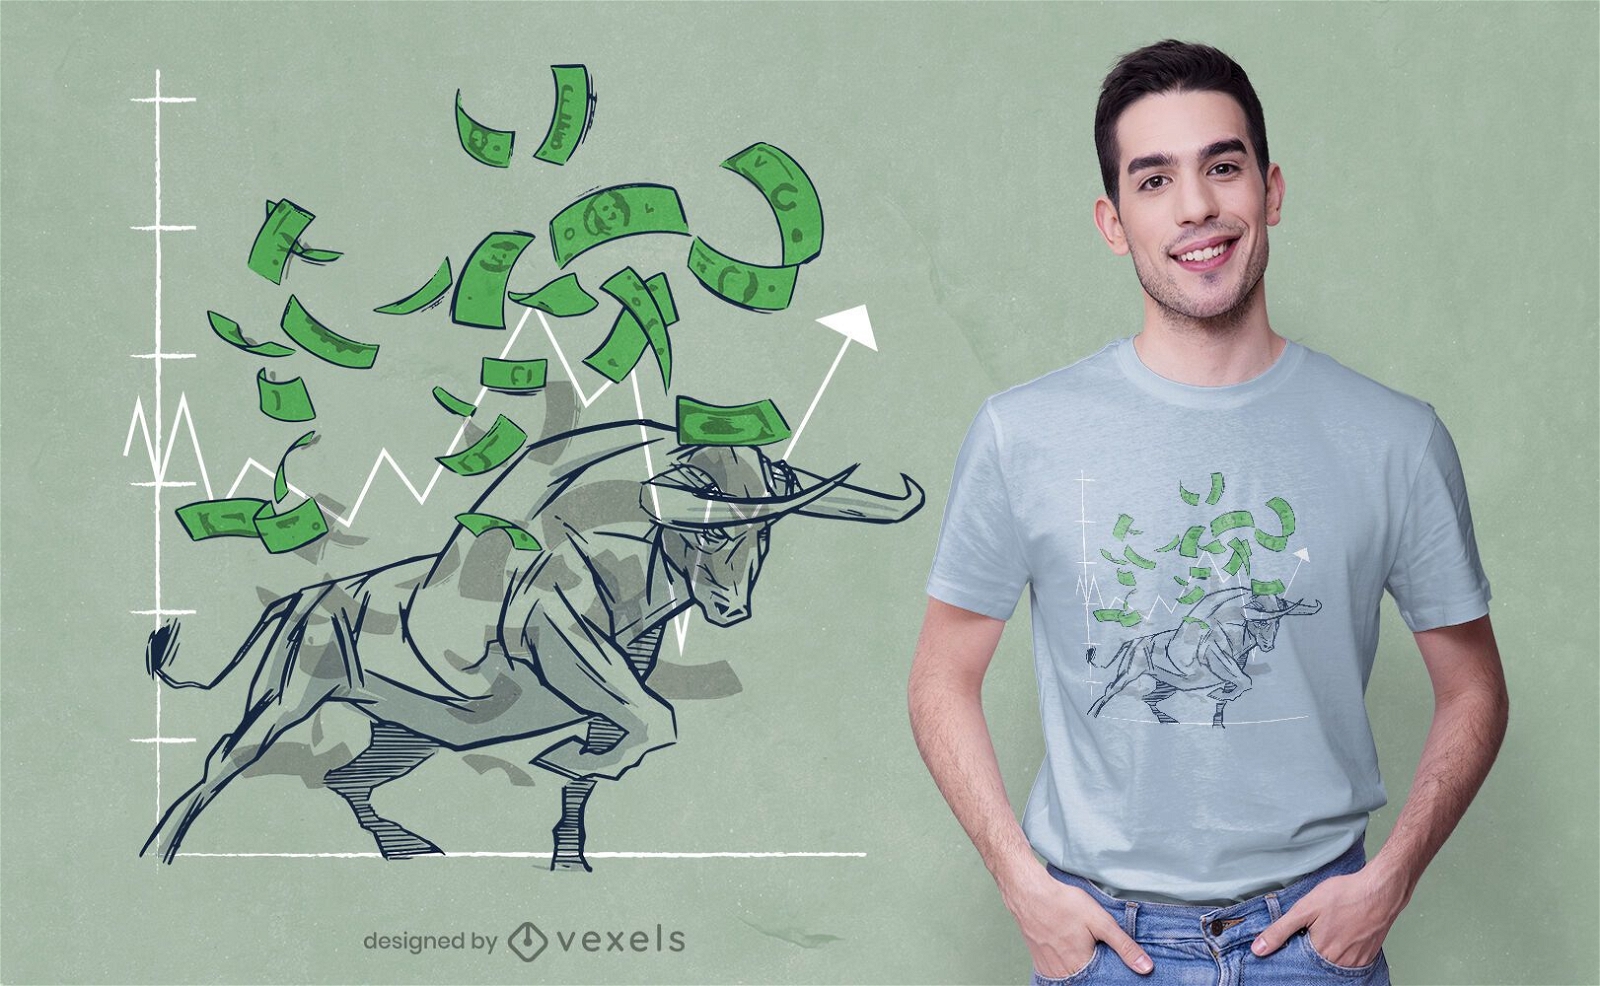
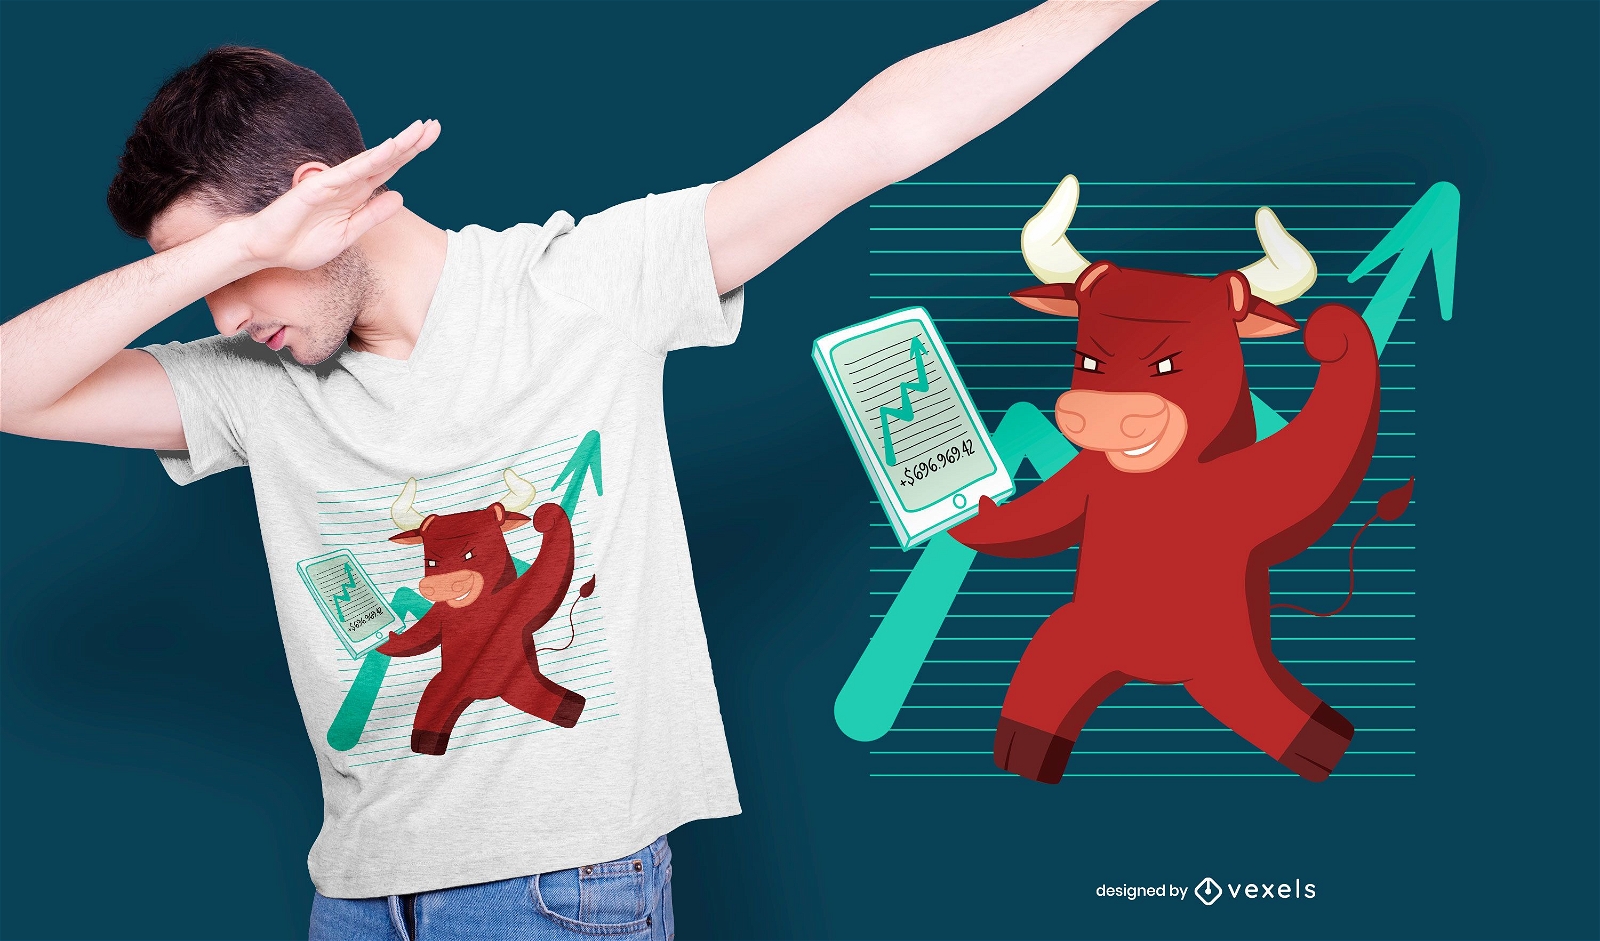
Bull stock market t-shirt design
Choose a folder
All favorites
Create new
Save
Bull stock market t-shirt design
Print ready
for Merch
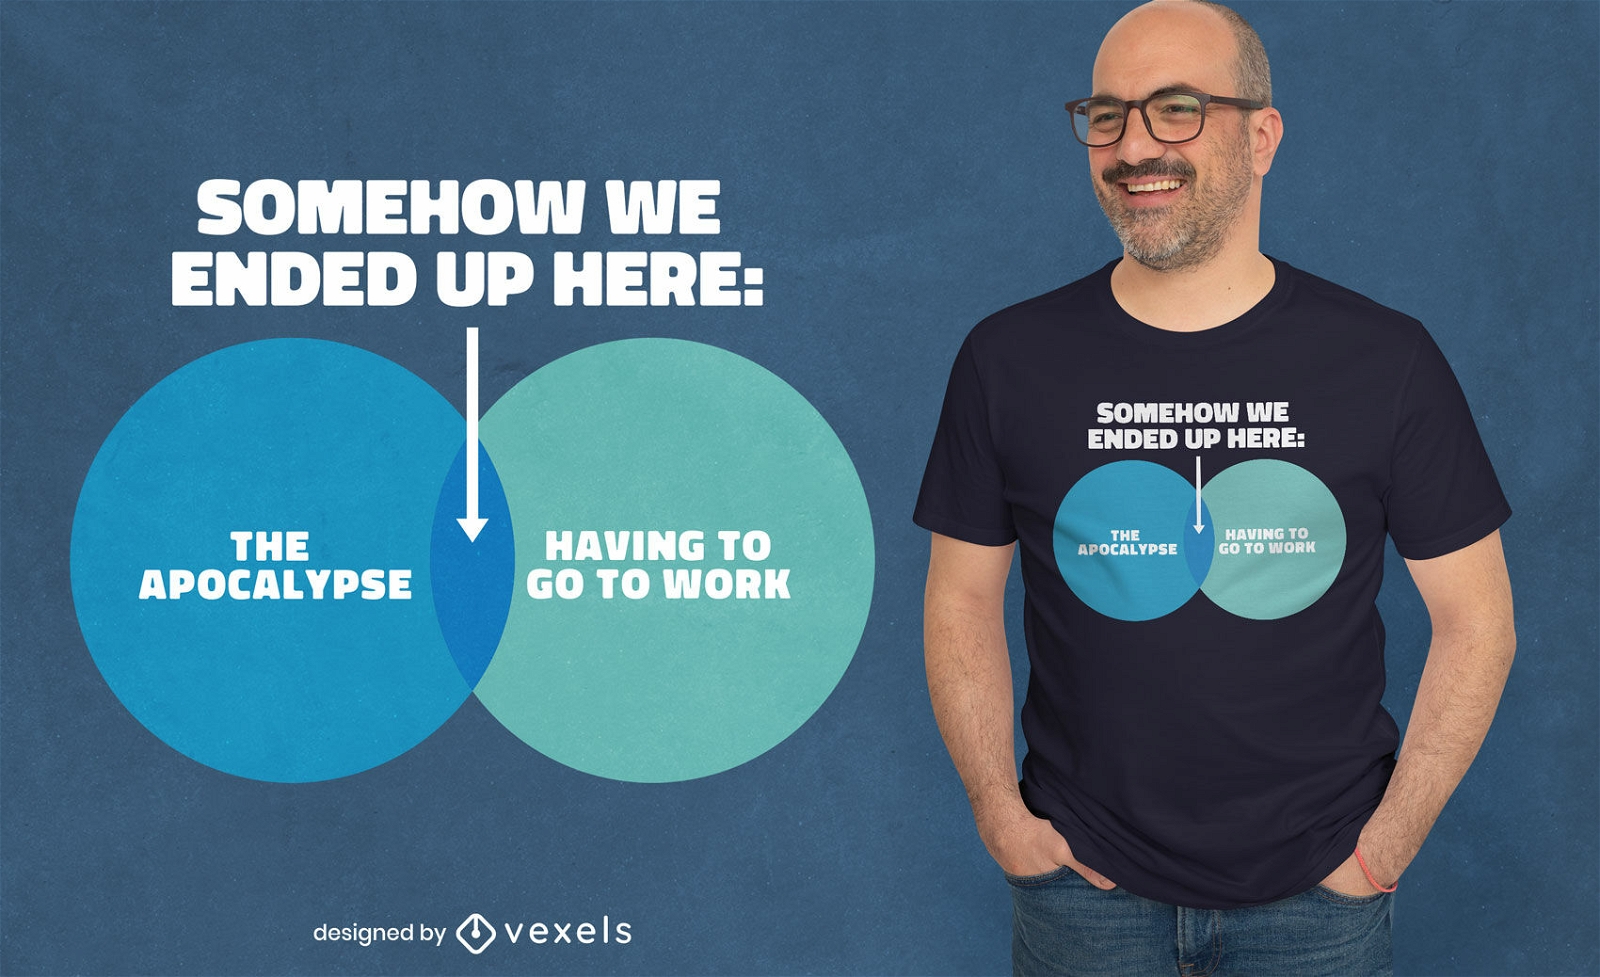
Apocalypse funny quote t-shirt design
Choose a folder
All favorites
Create new
Save
Apocalypse funny quote t-shirt design
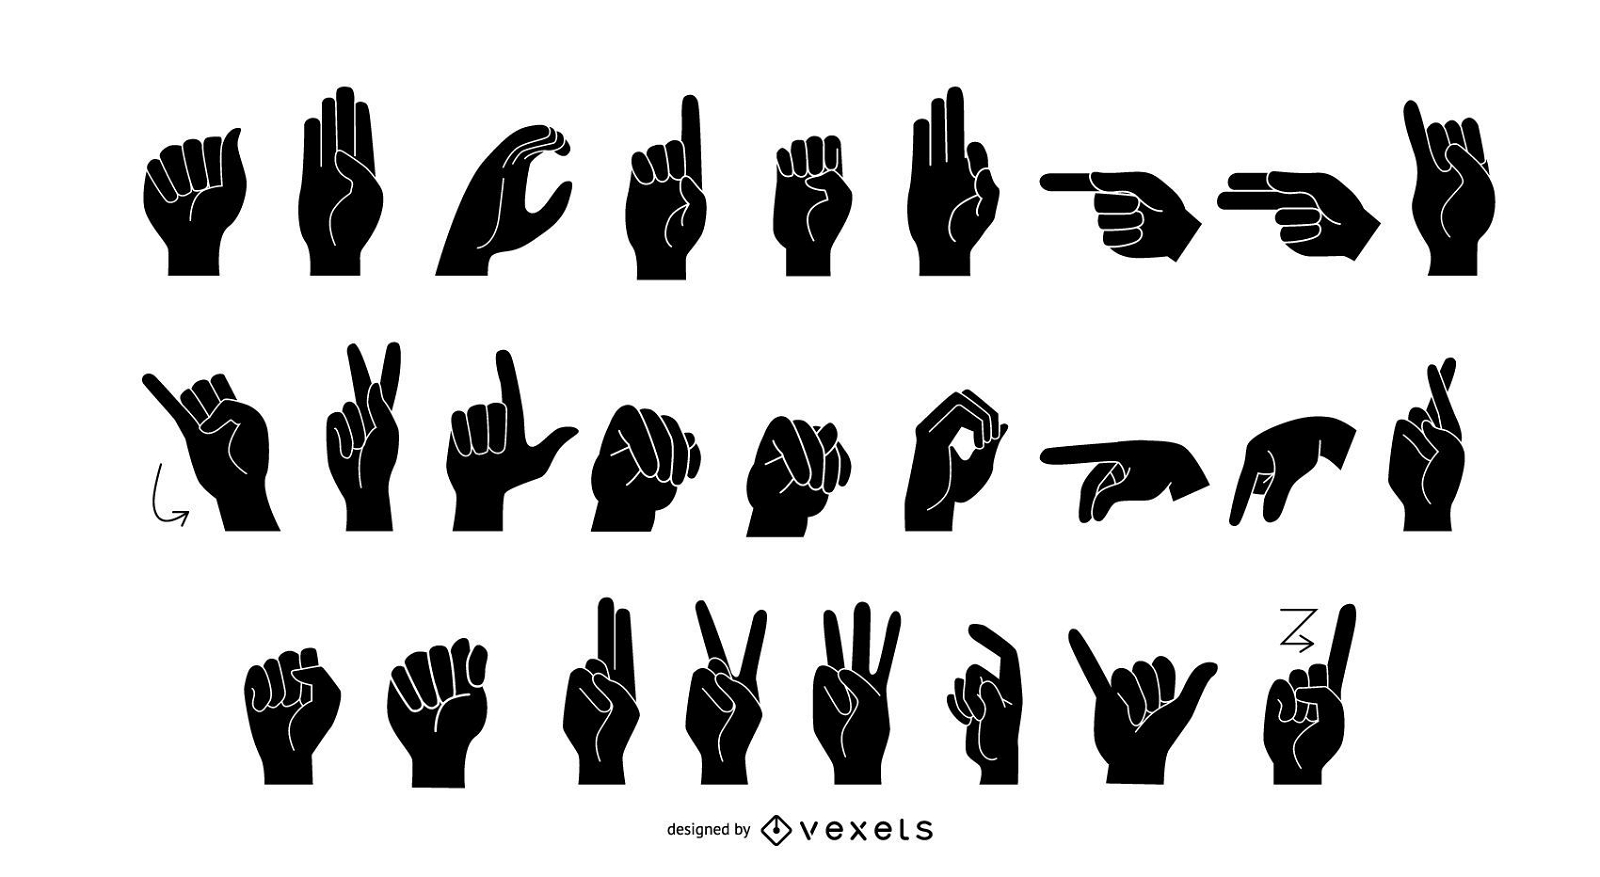
Sign Language Alphabet Silhouette
Choose a folder
All favorites
Create new
Save
Sign Language Alphabet Silhouette
Business and finance icons set
Choose a folder
All favorites
Create new
Save
Business and finance icons set
Elegant Business Icon Circle Pack
Choose a folder
All favorites
Create new
Save
Elegant Business Icon Circle Pack
Print ready
for Merch
Bull stocks t-shirt design
Choose a folder
All favorites
Create new
Save
Bull stocks t-shirt design
Premium
Graph bar chart icon PNG Design
Choose a folder
All favorites
Create new
Save
Graph bar chart icon PNG Design
Print ready
for Merch
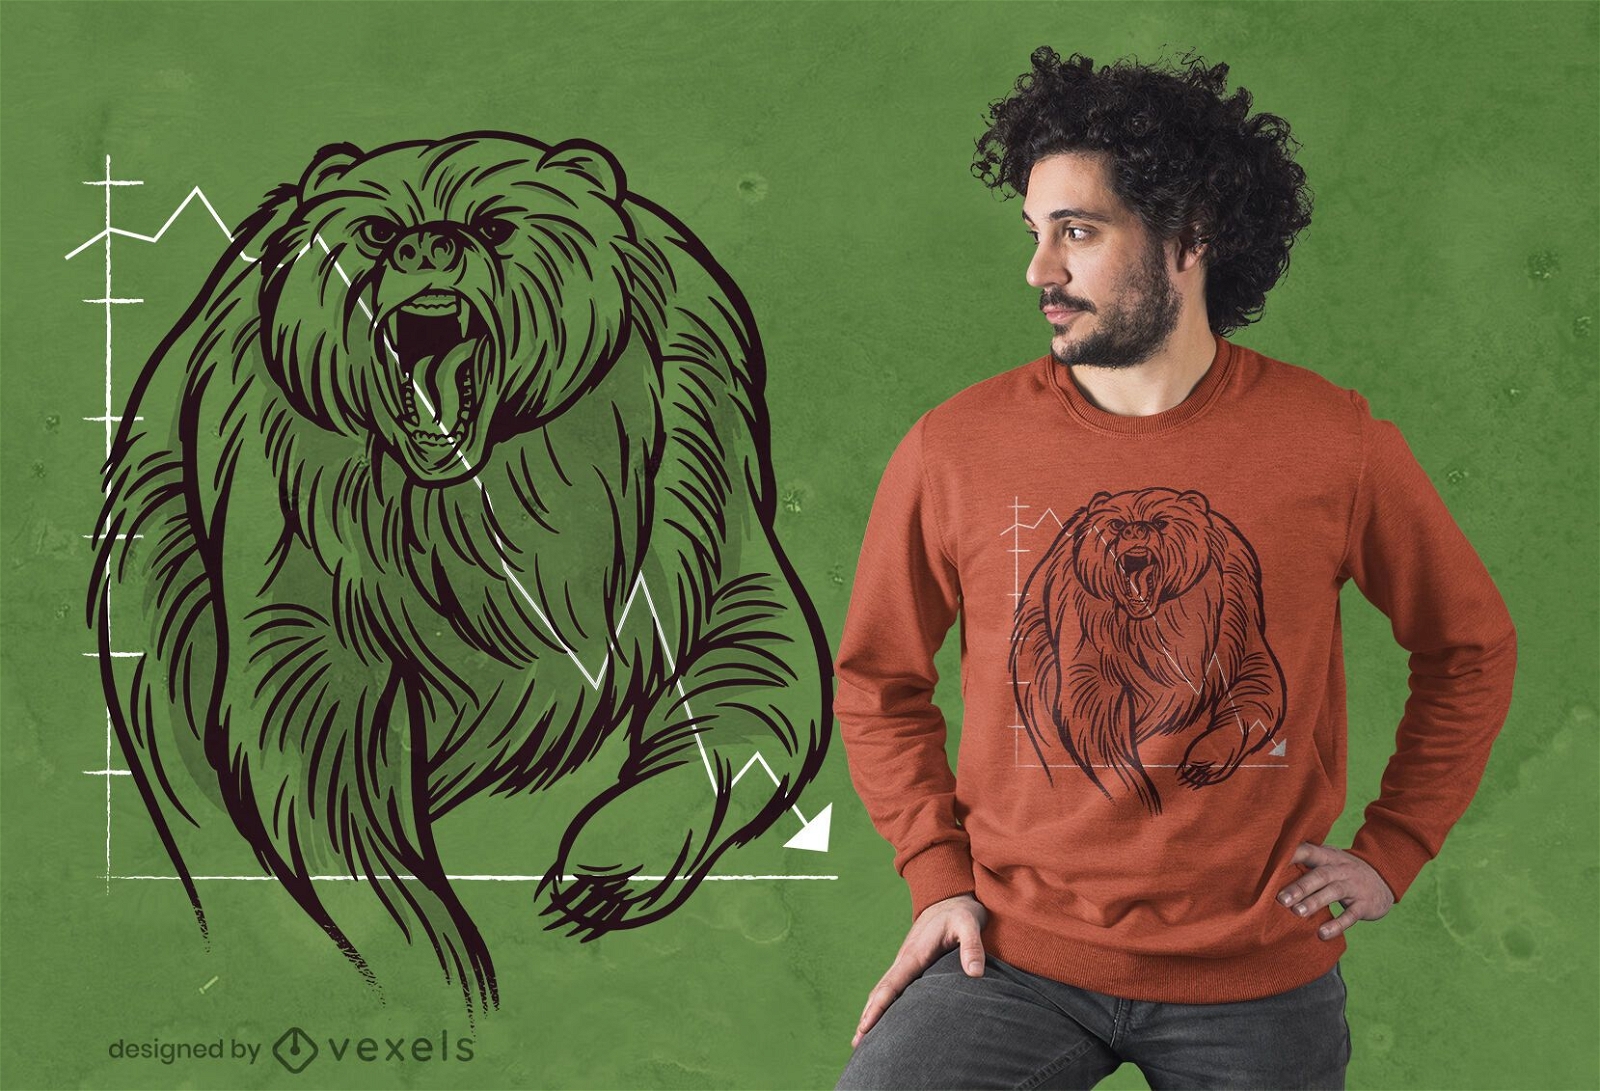
Stock market bear t-shirt design
Choose a folder
All favorites
Create new
Save
Stock market bear t-shirt design
3D Grey Pyramid Diagram Template
Choose a folder
All favorites
Create new
Save
3D Grey Pyramid Diagram Template
3d graph
Choose a folder
All favorites
Create new
Save
3d graph
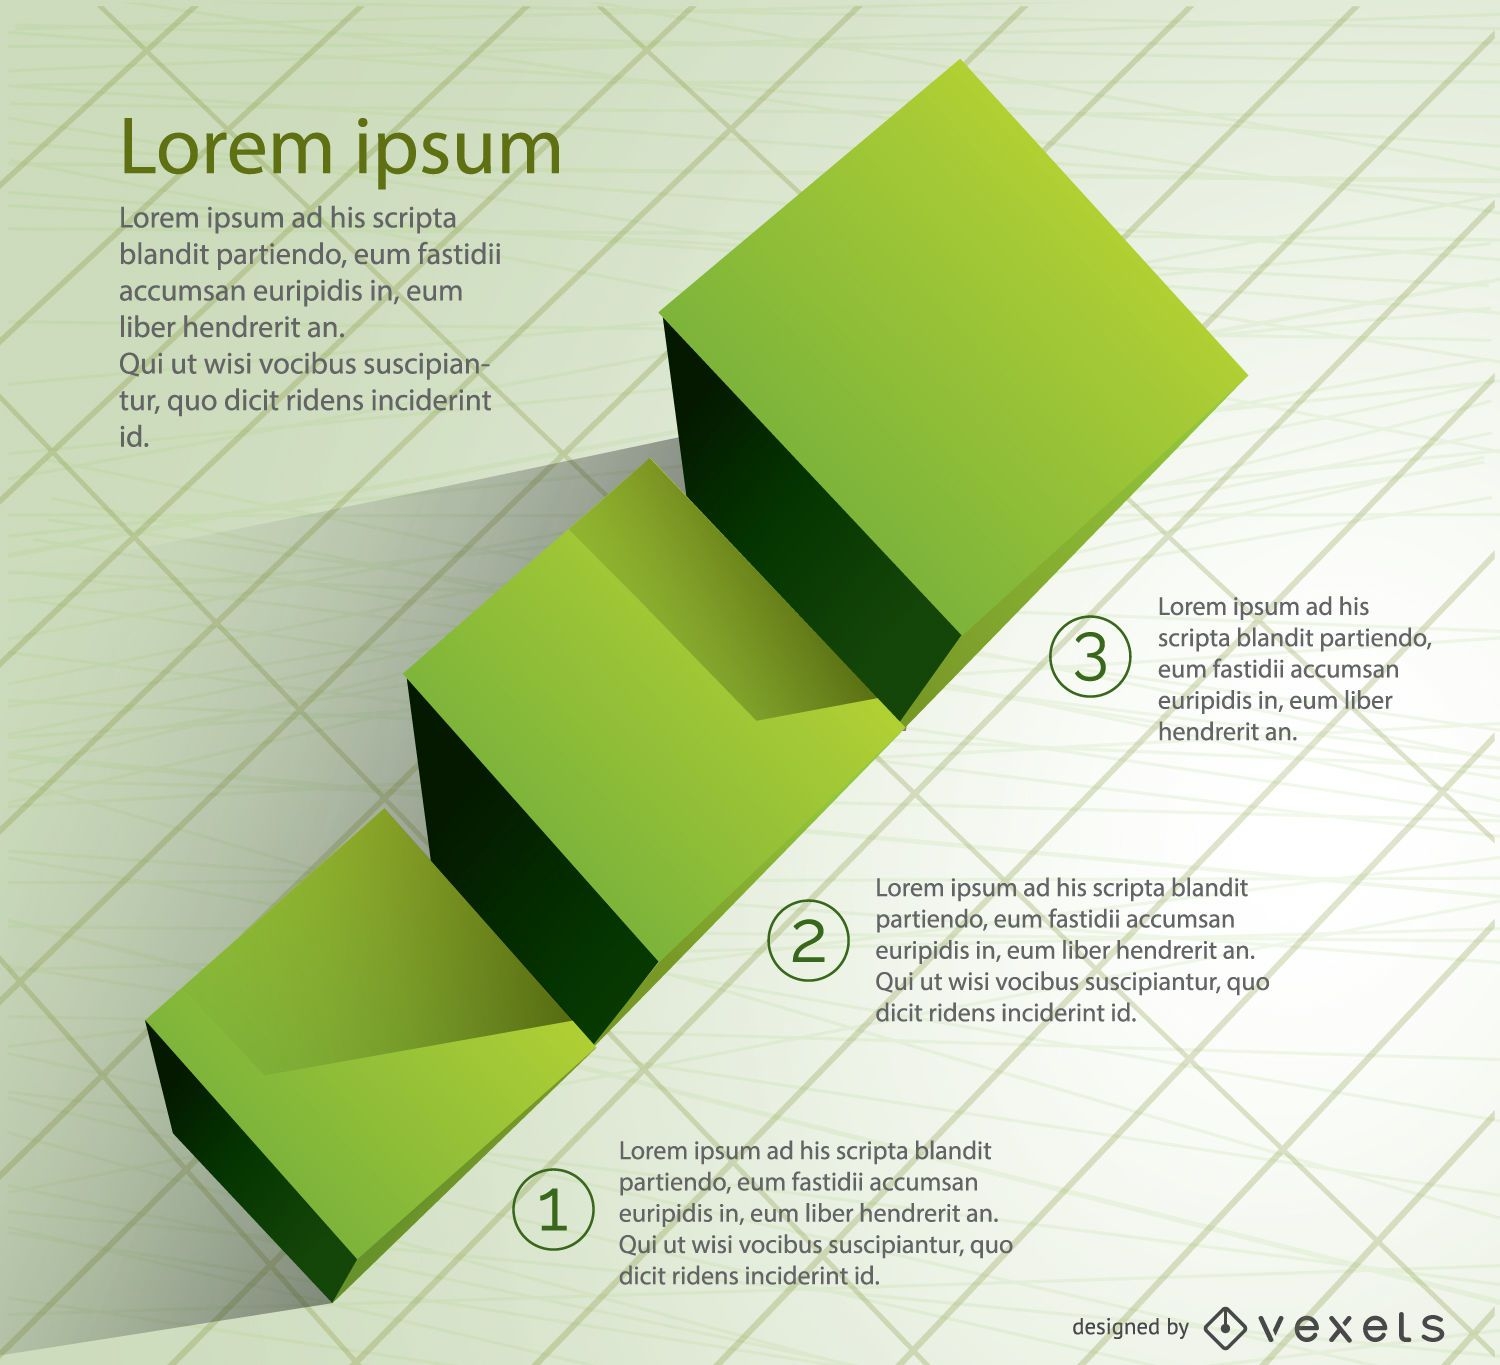
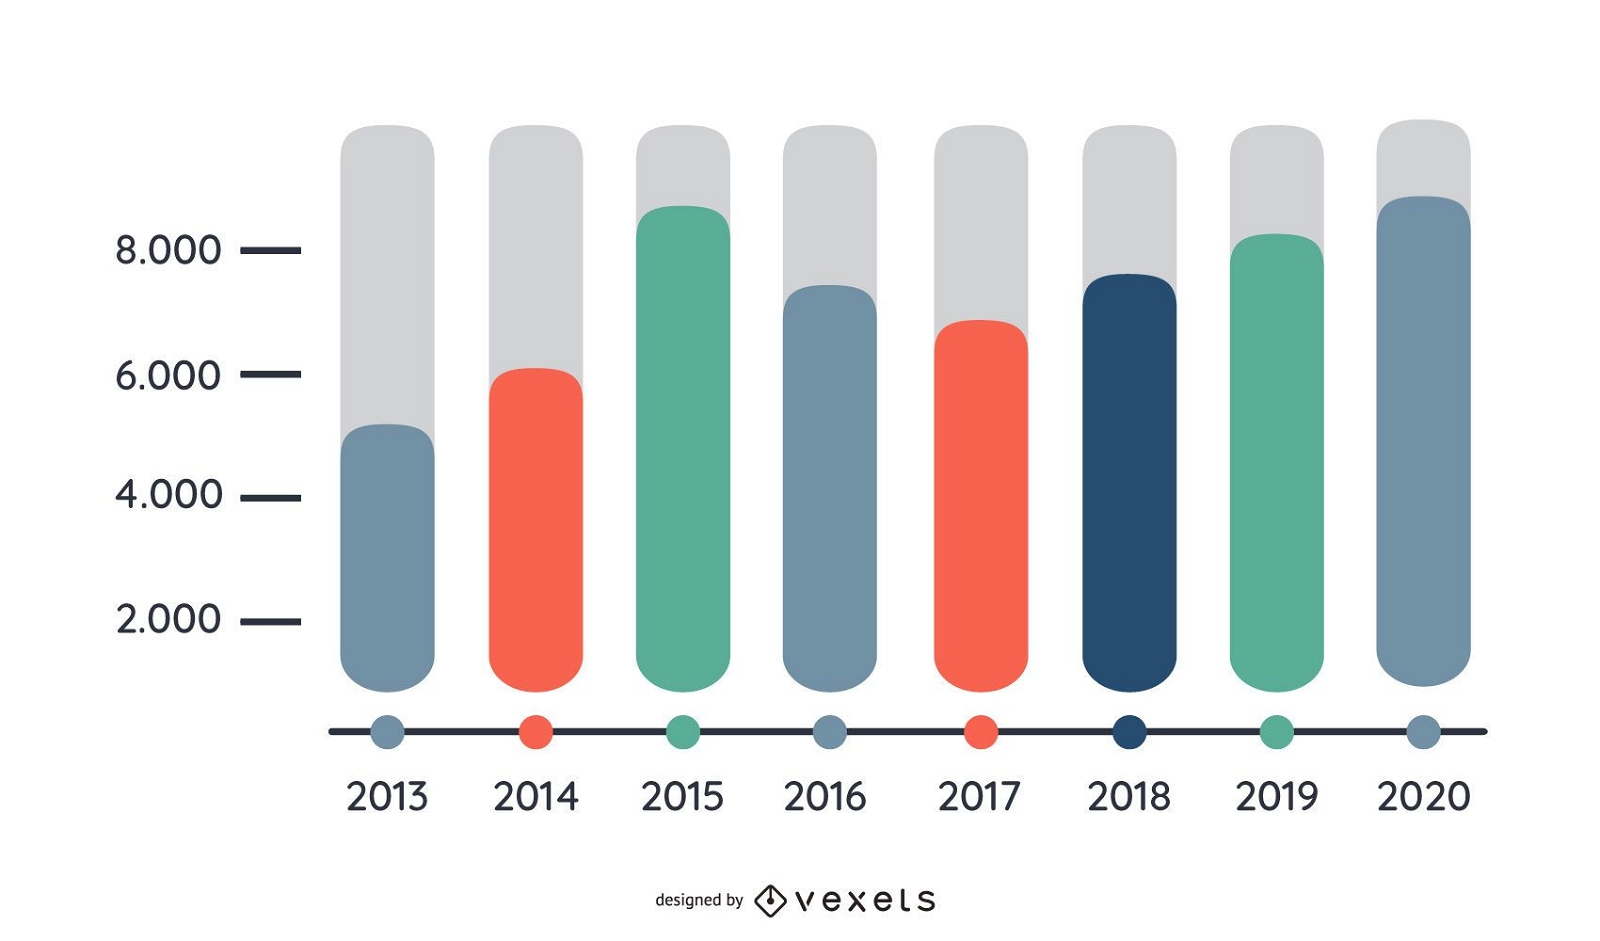
Round Corner Strip Graph Infographic
Choose a folder
All favorites
Create new
Save
Round Corner Strip Graph Infographic
Clean 3D Diagram Icons
Choose a folder
All favorites
Create new
Save
Clean 3D Diagram Icons
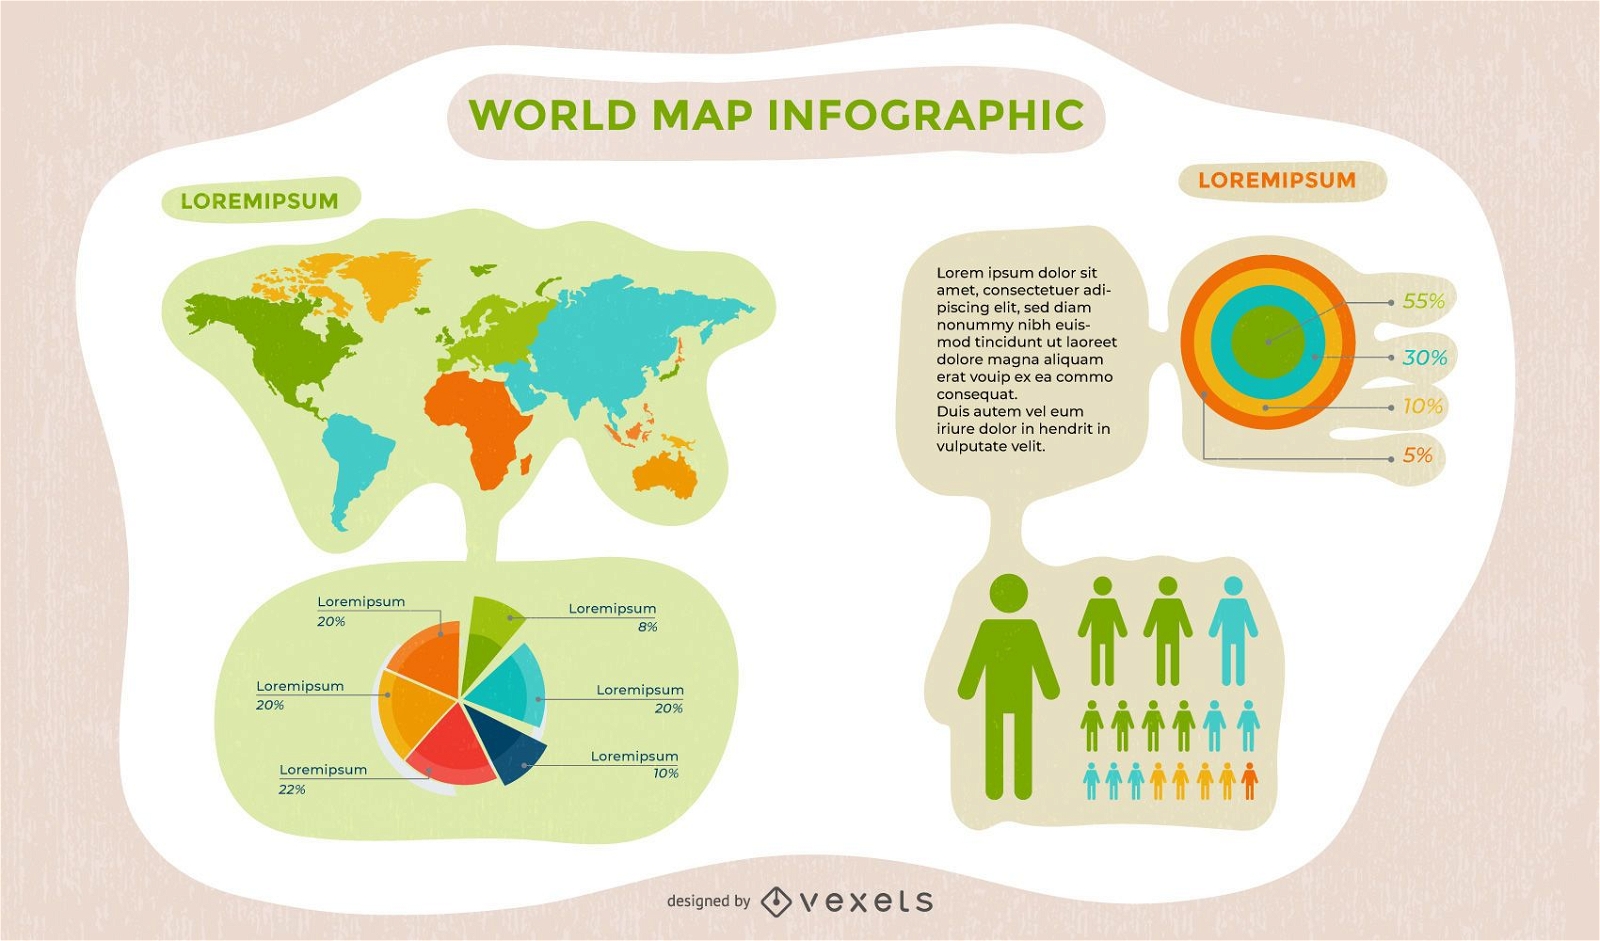
Communication World Map Infographic
Choose a folder
All favorites
Create new
Save
Communication World Map Infographic
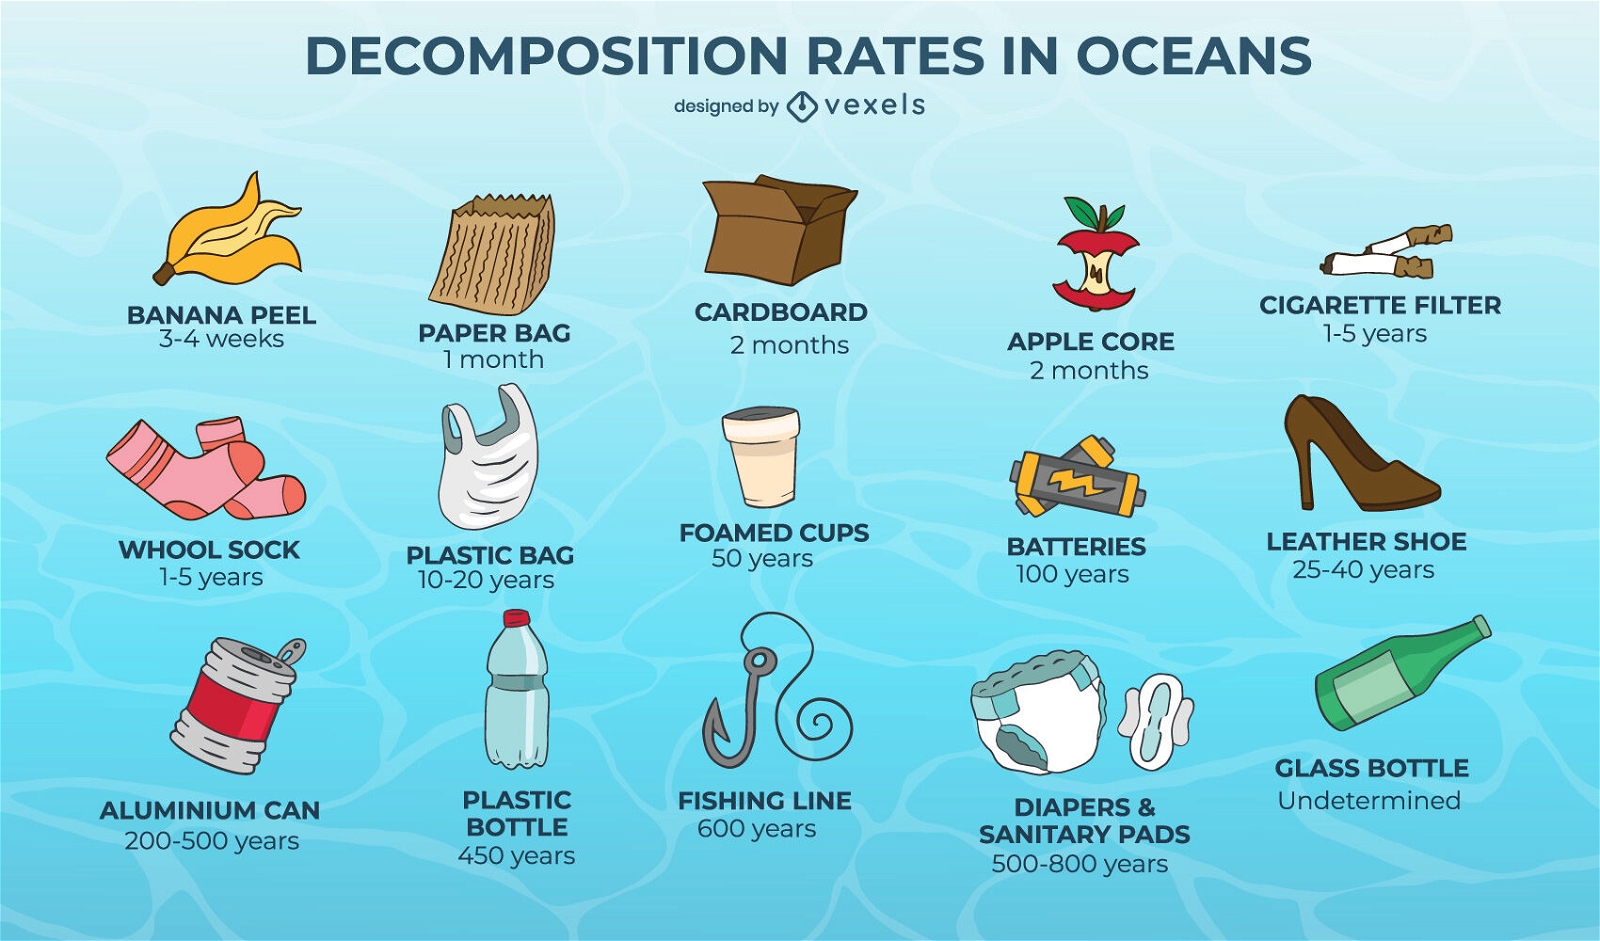
Ocean pollution object chart ecology set
Choose a folder
All favorites
Create new
Save
Ocean pollution object chart ecology set
Print ready
for Merch
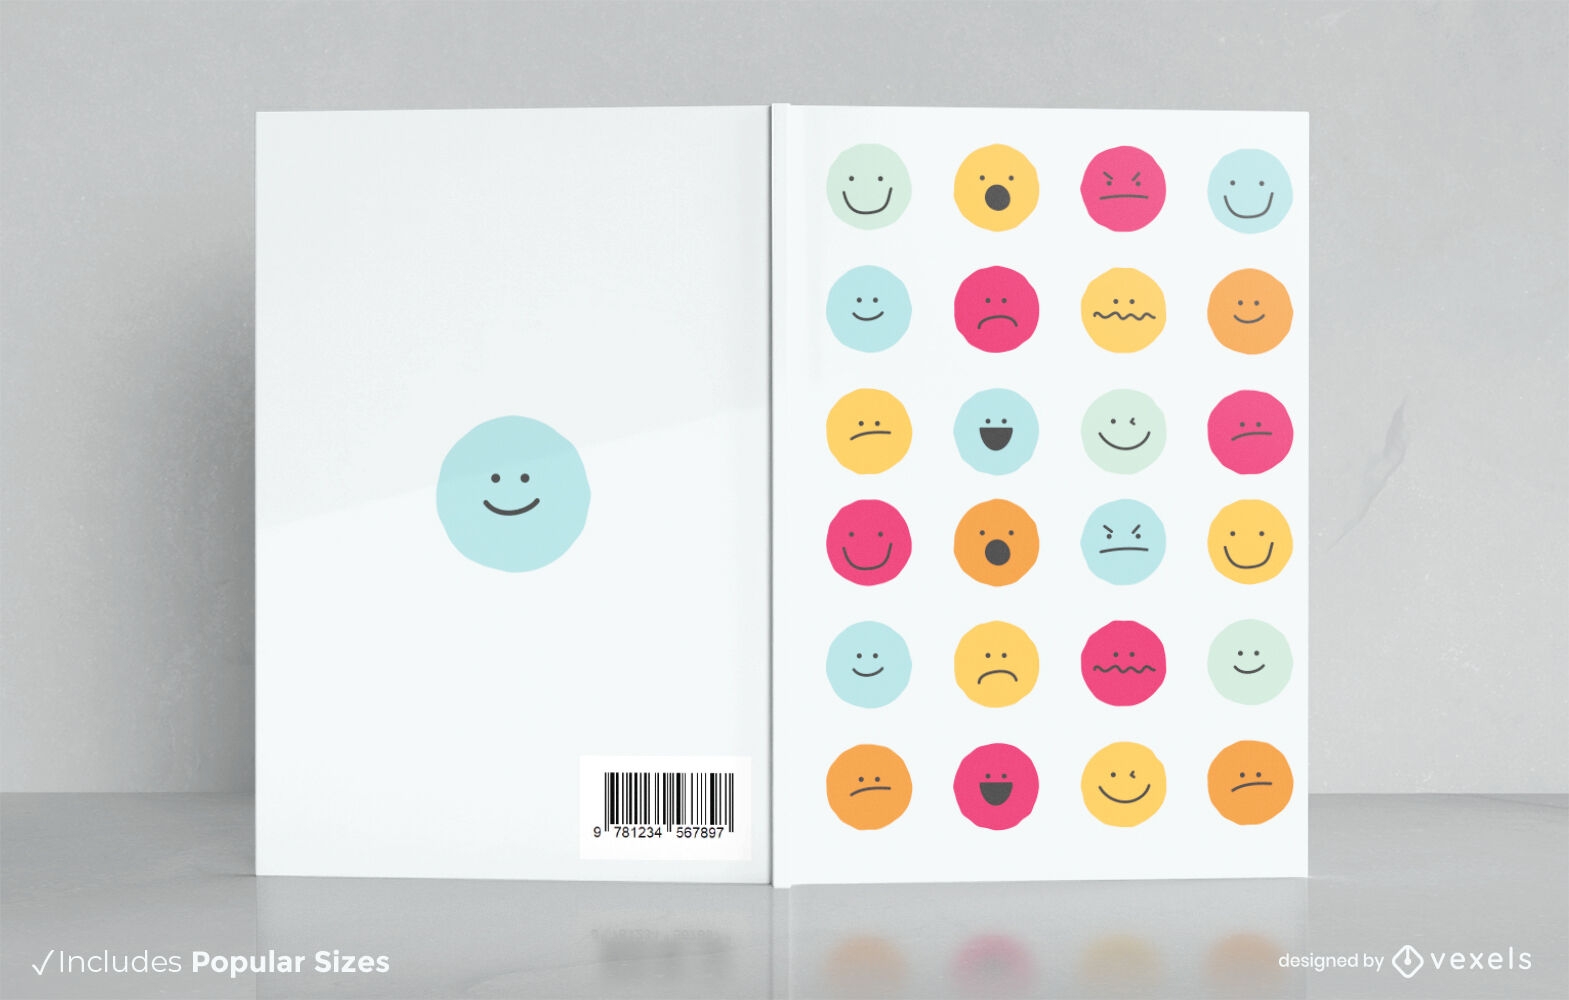
Emotion chart book cover design KDP
Choose a folder
All favorites
Create new
Save
Emotion chart book cover design KDP
Editable text
Premium
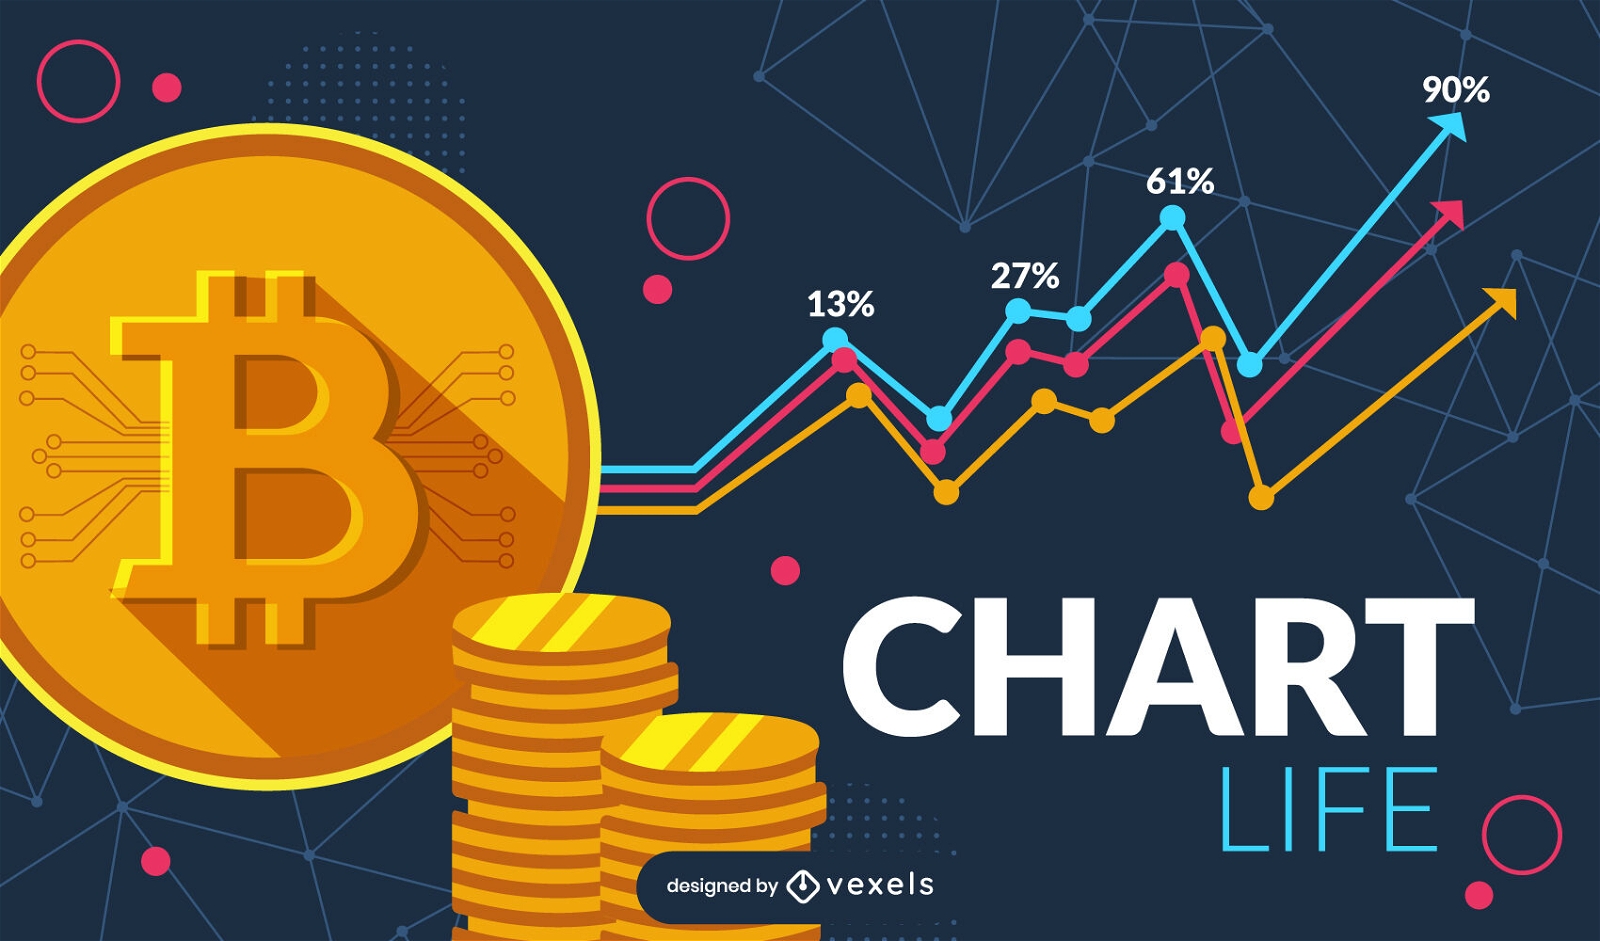
Crypto currency banner template
Choose a folder
All favorites
Create new
Save
Crypto currency banner template
Premium
Graph pie chart icon PNG Design
Choose a folder
All favorites
Create new
Save
Graph pie chart icon PNG Design
E-Commerce & Business Circular Info-graphic
Choose a folder
All favorites
Create new
Save
E-Commerce & Business Circular Info-graphic
Silhouette Business People with Info-graphics
Choose a folder
All favorites
Create new
Save
Silhouette Business People with Info-graphics
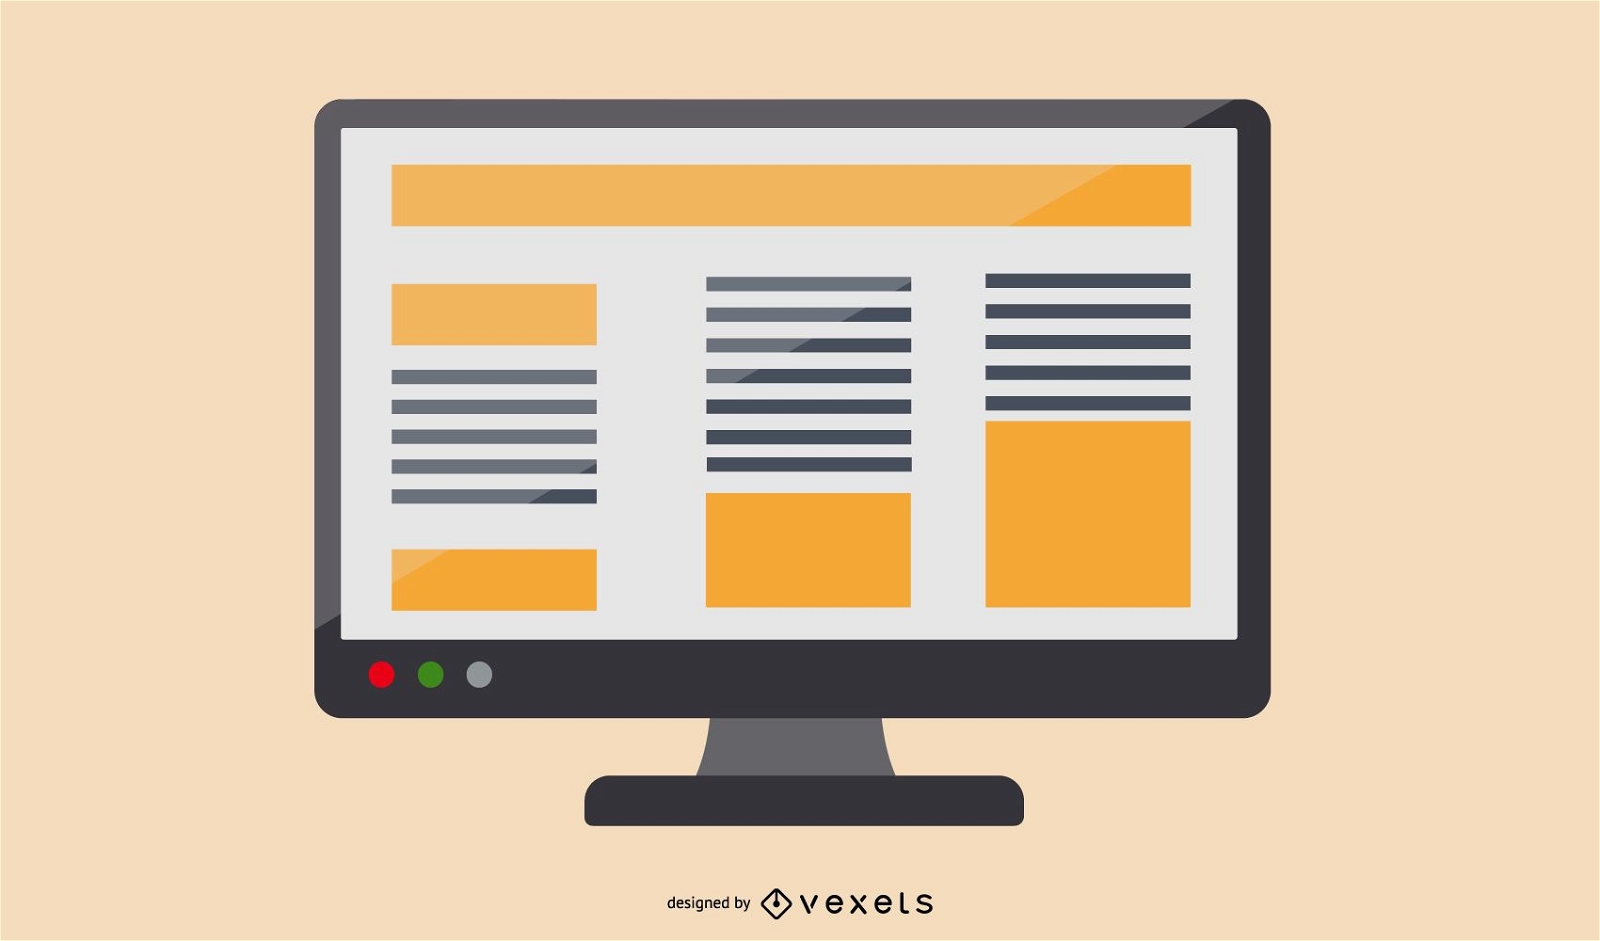
Business News Layout Monitor
Choose a folder
All favorites
Create new
Save
Business News Layout Monitor
Boost Your Business
With The Leading Graphic Platform For Merch.
SEE PLANS
Next
of 11
prev page
next page