Design Library
Explore Designs
New Merch Designs
Trending Merch Designs
Vectors
PNGs & SVGs
Mockups
T-Shirts
T-Shirt PSD Templates
KDP Designs
Phone Cases
Pillows
Tote Bags
Posters
Mugs
Design Tools
Designer
New!
T-shirt Maker
Mockup Generator
Quote Generator
Logo Maker
Resources
Merch Digest
Blog
Help Center
Creators Program
Learn About Merch
Changelog
Pricing
Loading...
Sign Up
Login
All
charts
Design Library
Explore Designs
New Merch Designs
Trending Merch Designs
Vectors
PNGs & SVGs
Mockups
T-Shirts
T-Shirt PSD Templates
KDP Designs
Phone Cases
Pillows
Tote Bags
Posters
Mugs
Design Tools
Designer
New!
T-shirt Maker
Mockup Generator
Quote Generator
Logo Maker
Resources
Merch Digest
Blog
Help Center
Creators Program
Learn About Merch
Changelog
PLANS
All
charts
97 charts designs graphics for t-shirt and print on demand merch
Download charts t-shirt designs and other merch graphics like book covers, phone cases, tote bags and more.
Related:
pie charts
Sort by
Most relevant
Sponsored results by
Get 15% off with code: VEXELS15
Show more
Online Marketing Banner
Choose a folder
All favorites
Create new
Save
Online Marketing Banner
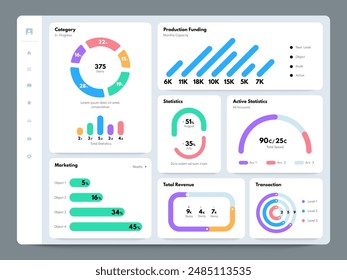
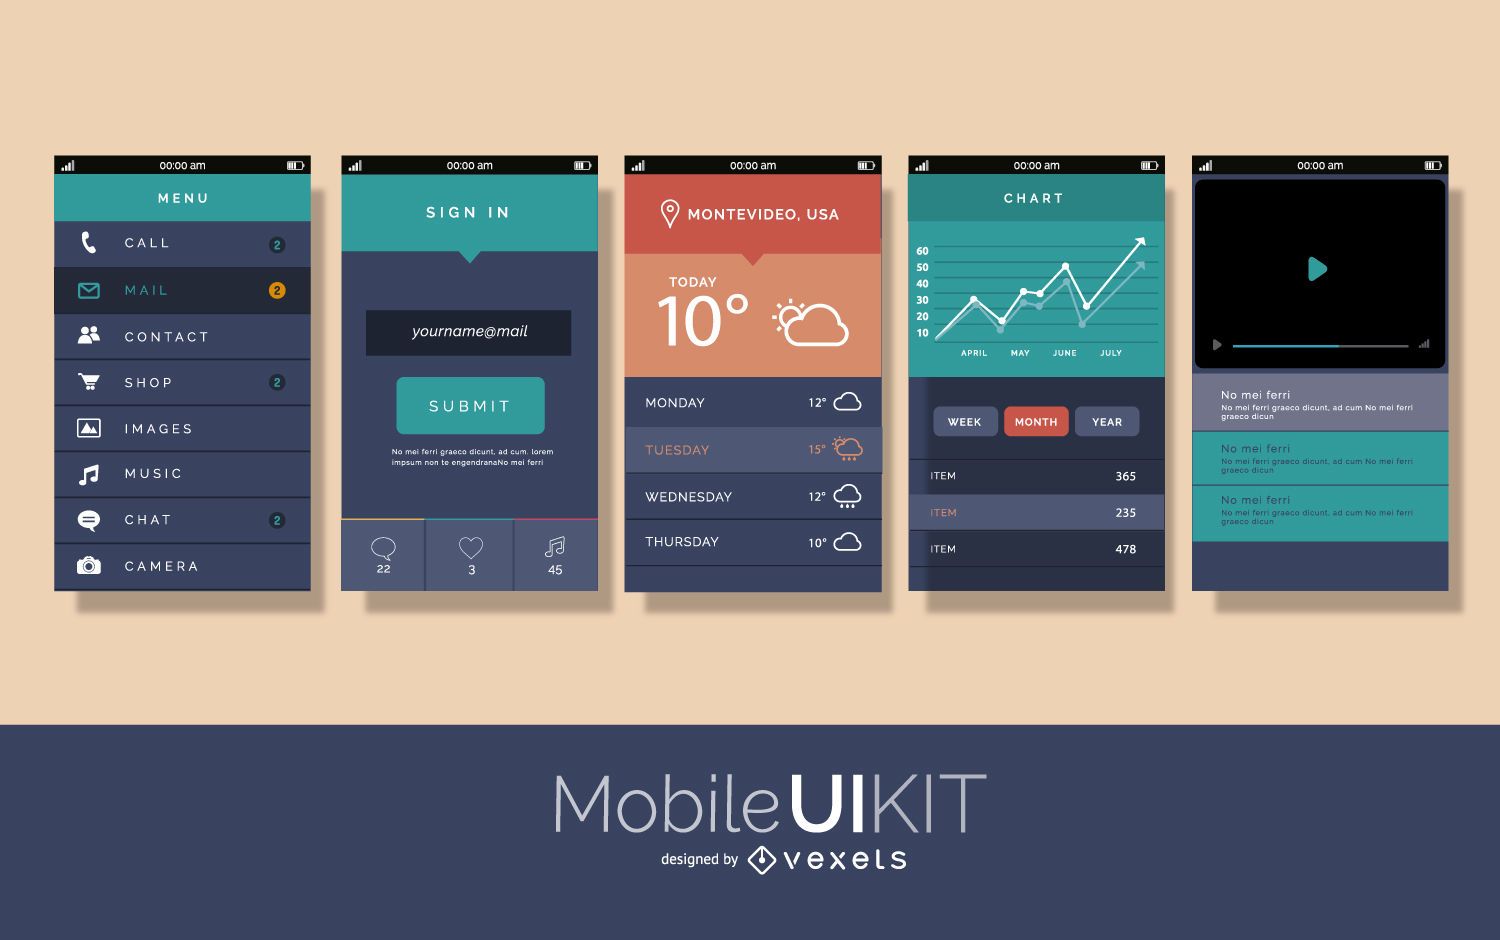
Material design mobile user interface
Choose a folder
All favorites
Create new
Save
Material design mobile user interface
Editable text
Premium
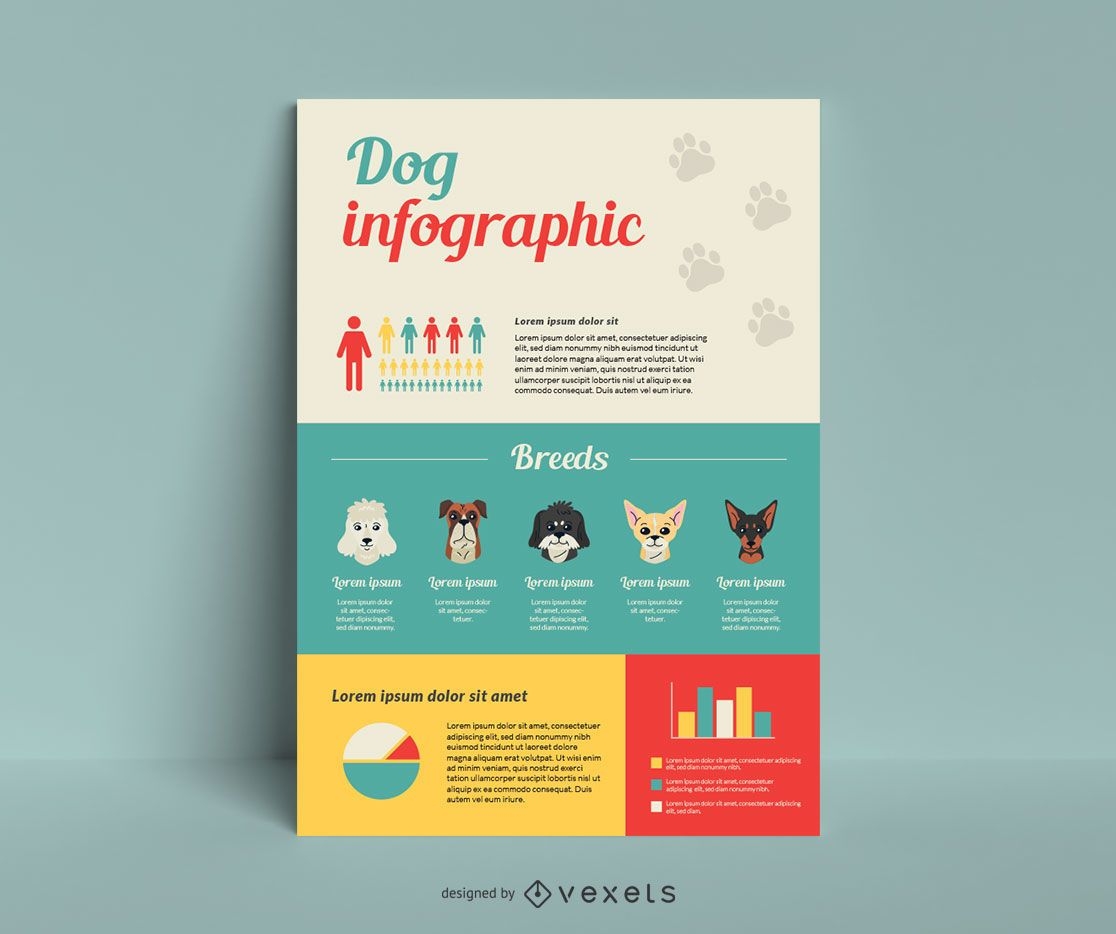
Dog breed infographic template
Choose a folder
All favorites
Create new
Save
Dog breed infographic template
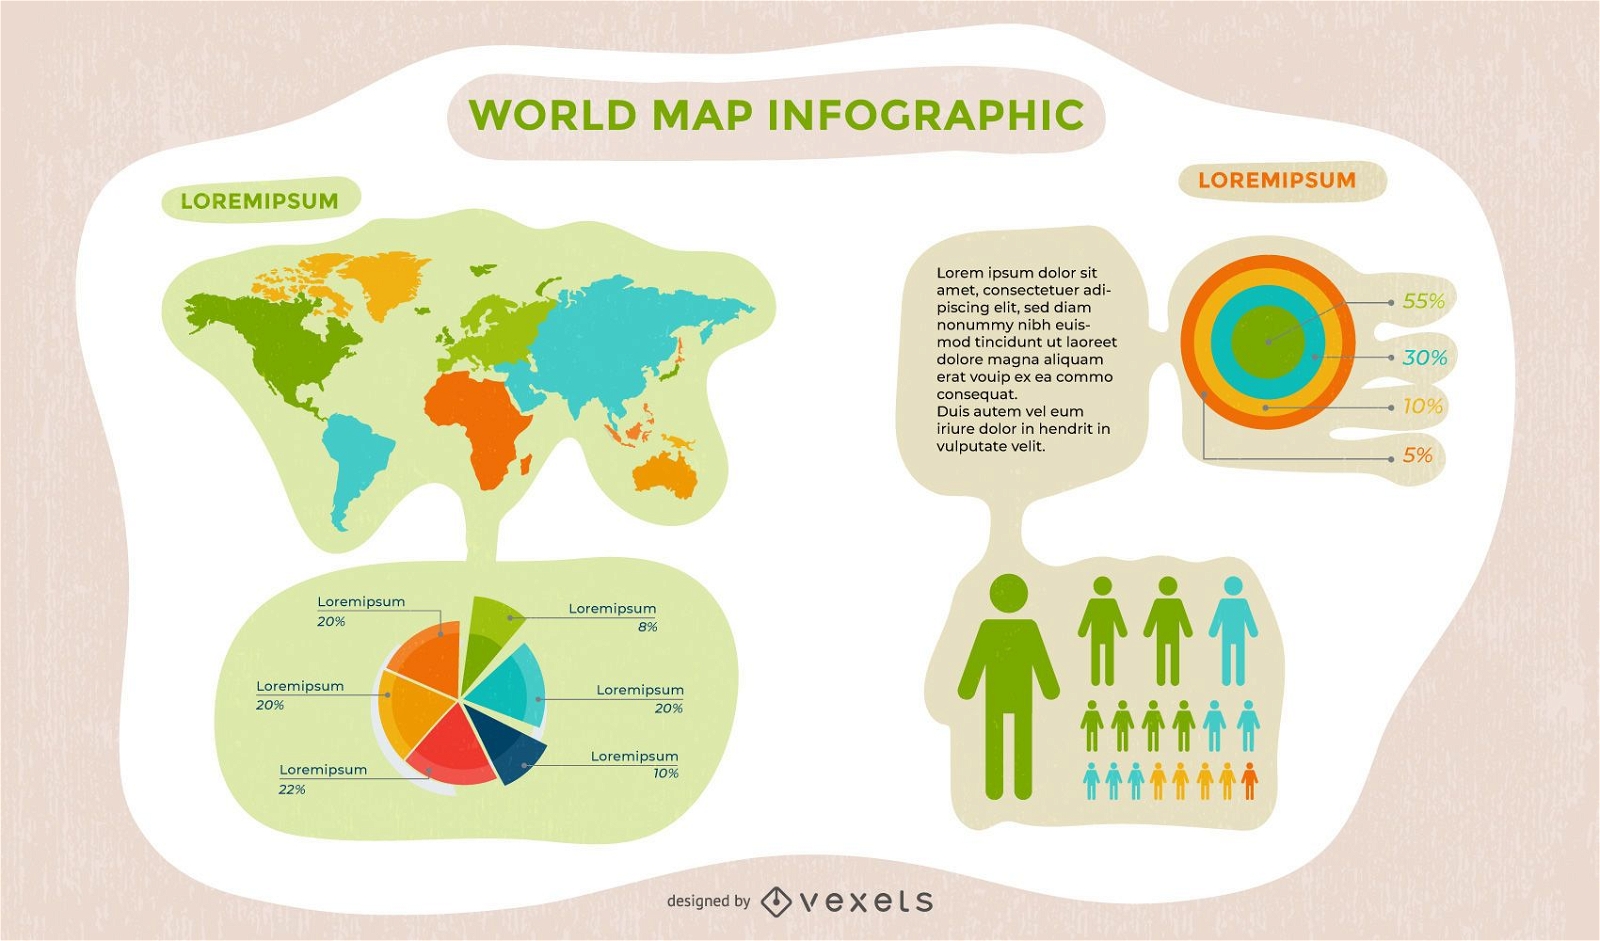
Communication World Map Infographic
Choose a folder
All favorites
Create new
Save
Communication World Map Infographic
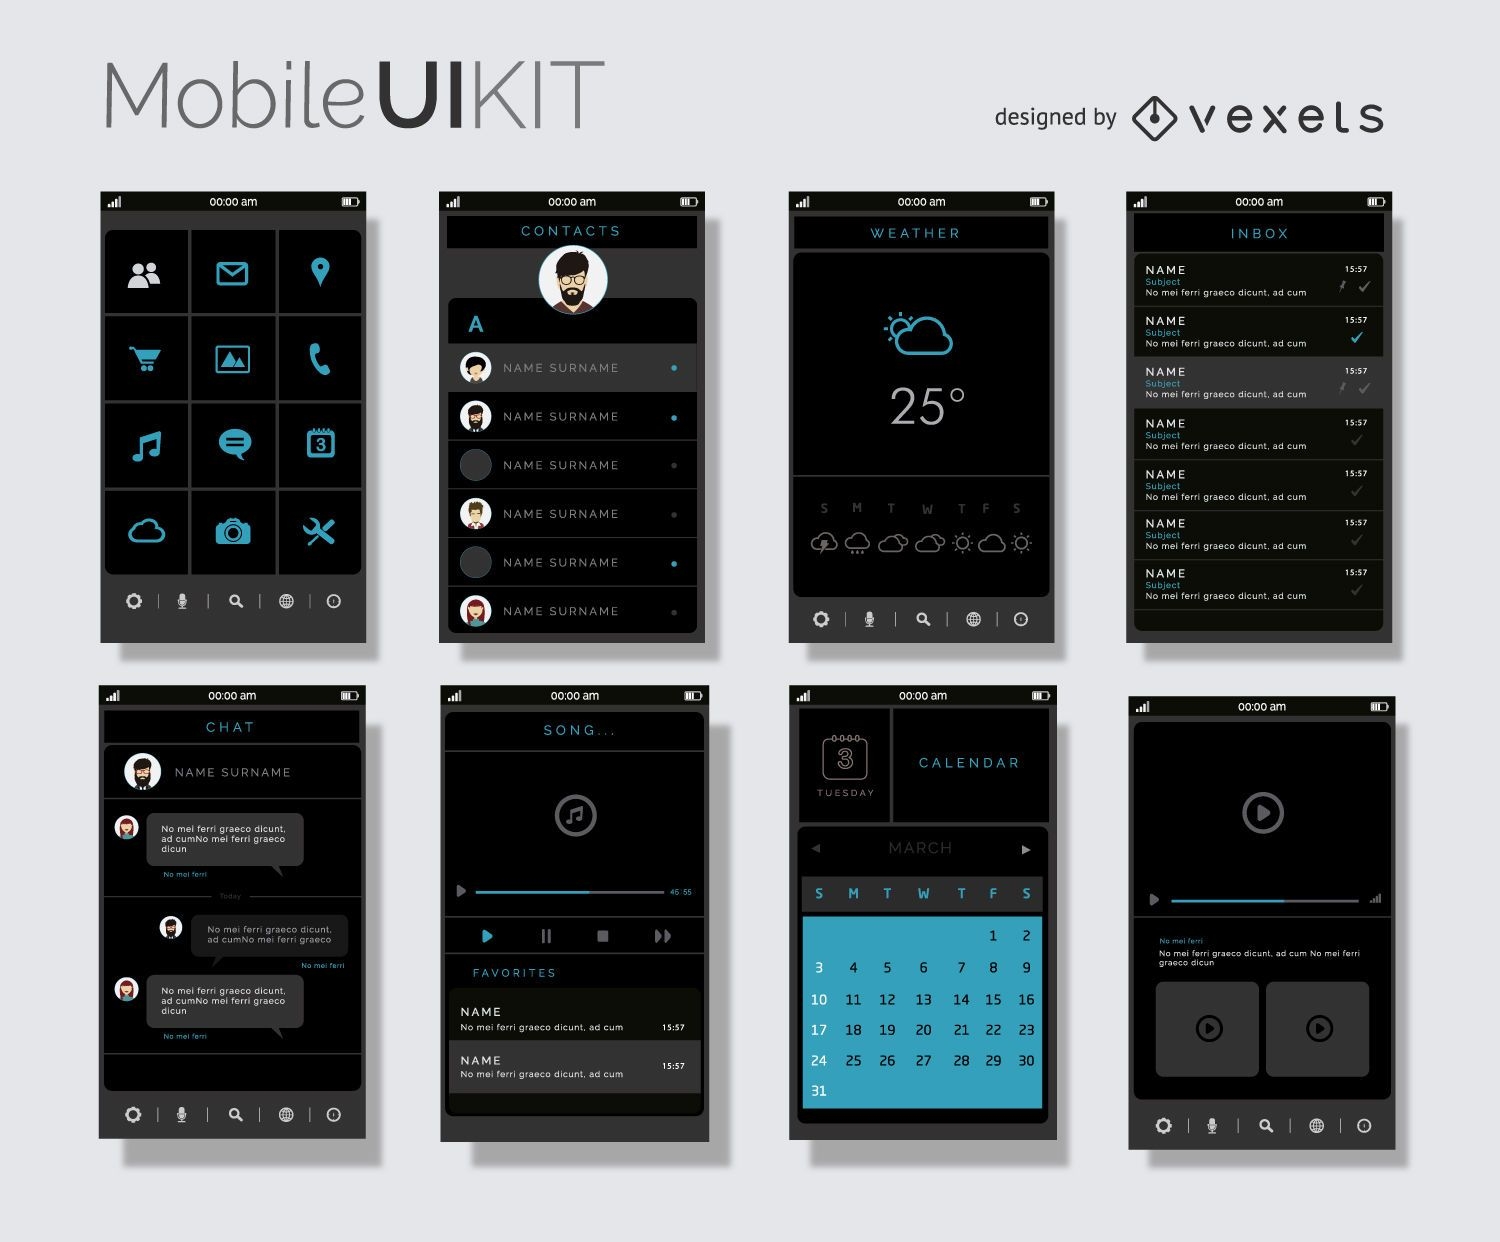
Mobile user interface layouts kit
Choose a folder
All favorites
Create new
Save
Mobile user interface layouts kit
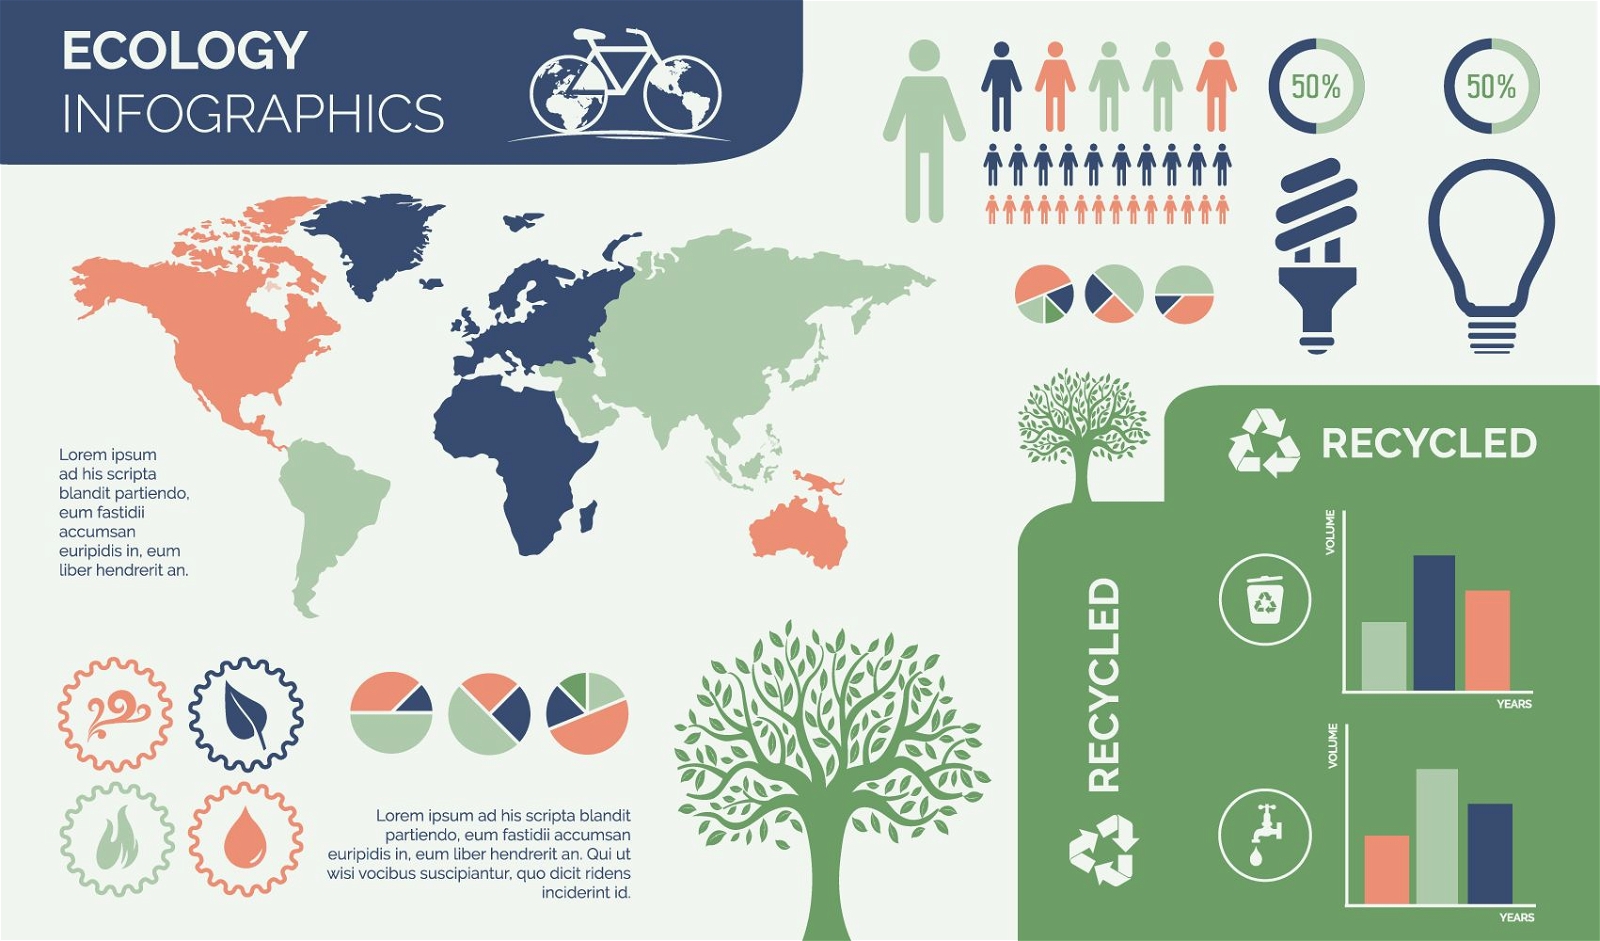
Environmental Ecology Infographic Design
Choose a folder
All favorites
Create new
Save
Environmental Ecology Infographic Design
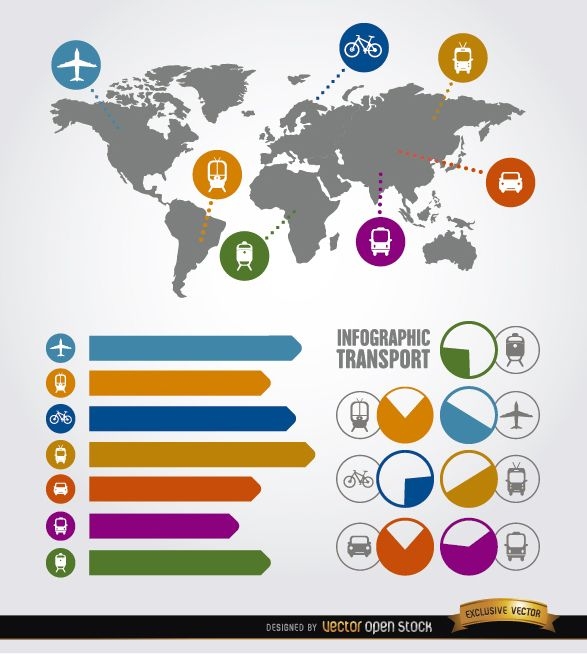
Travel infographic transport elements
Choose a folder
All favorites
Create new
Save
Travel infographic transport elements
Editable Slides
Premium
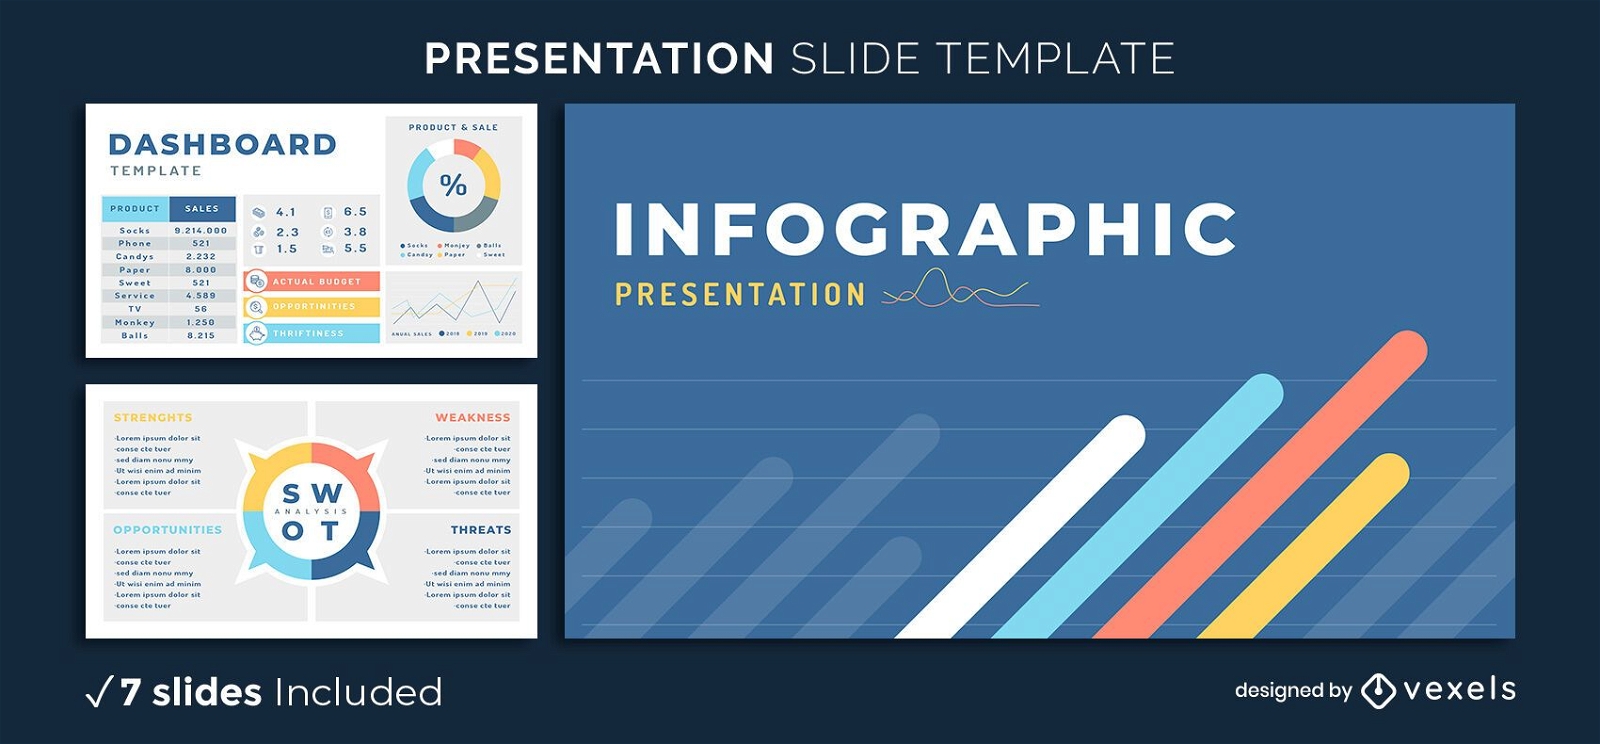
Infographic Elements Presentation Template
Choose a folder
All favorites
Create new
Save
Infographic Elements Presentation Template
Editable Slides
Premium
Teamwork Characters Presentation Template
Choose a folder
All favorites
Create new
Save
Teamwork Characters Presentation Template
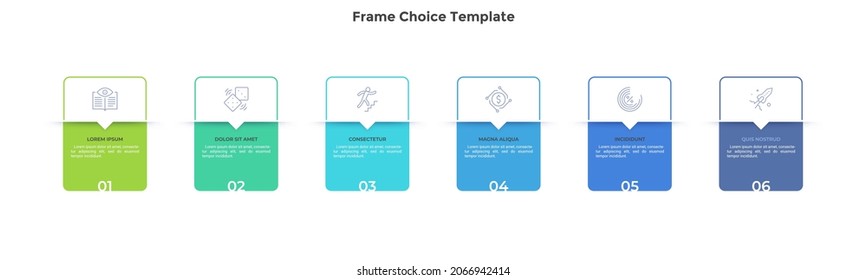
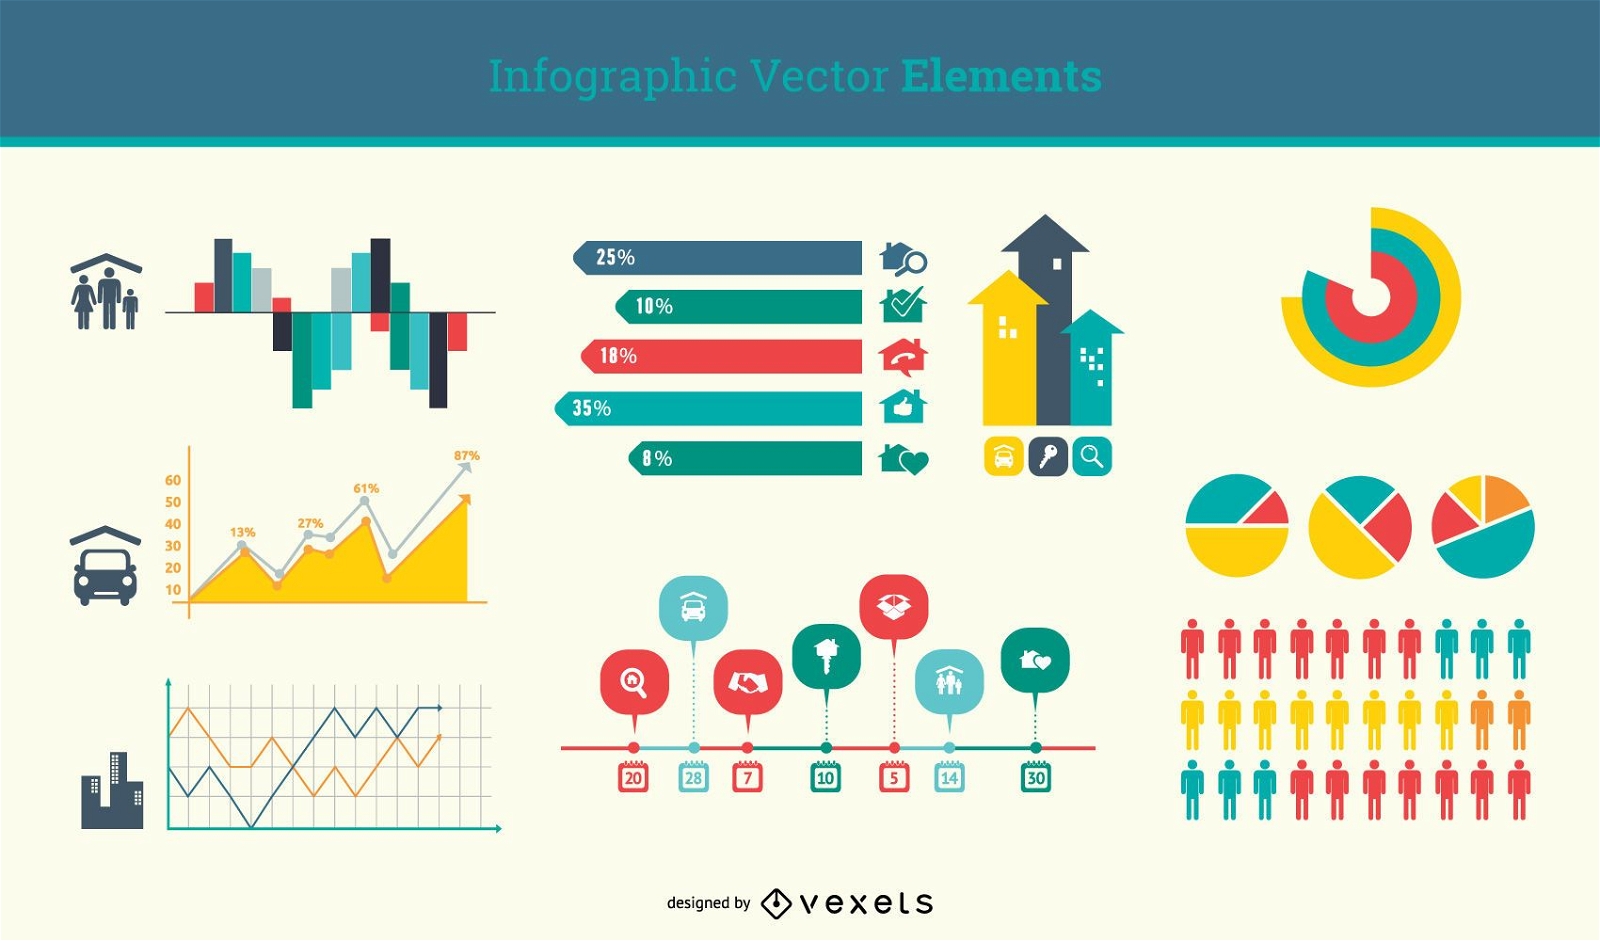
Flat Minimal Infographic Element Set
Choose a folder
All favorites
Create new
Save
Flat Minimal Infographic Element Set
Editable Slides
Premium
Organic Shapes Presentation Template
Choose a folder
All favorites
Create new
Save
Organic Shapes Presentation Template
Editable Slides
Premium
Online Education Presentation Template
Choose a folder
All favorites
Create new
Save
Online Education Presentation Template
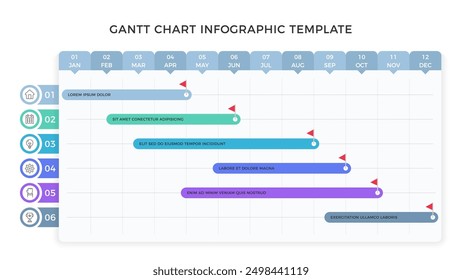
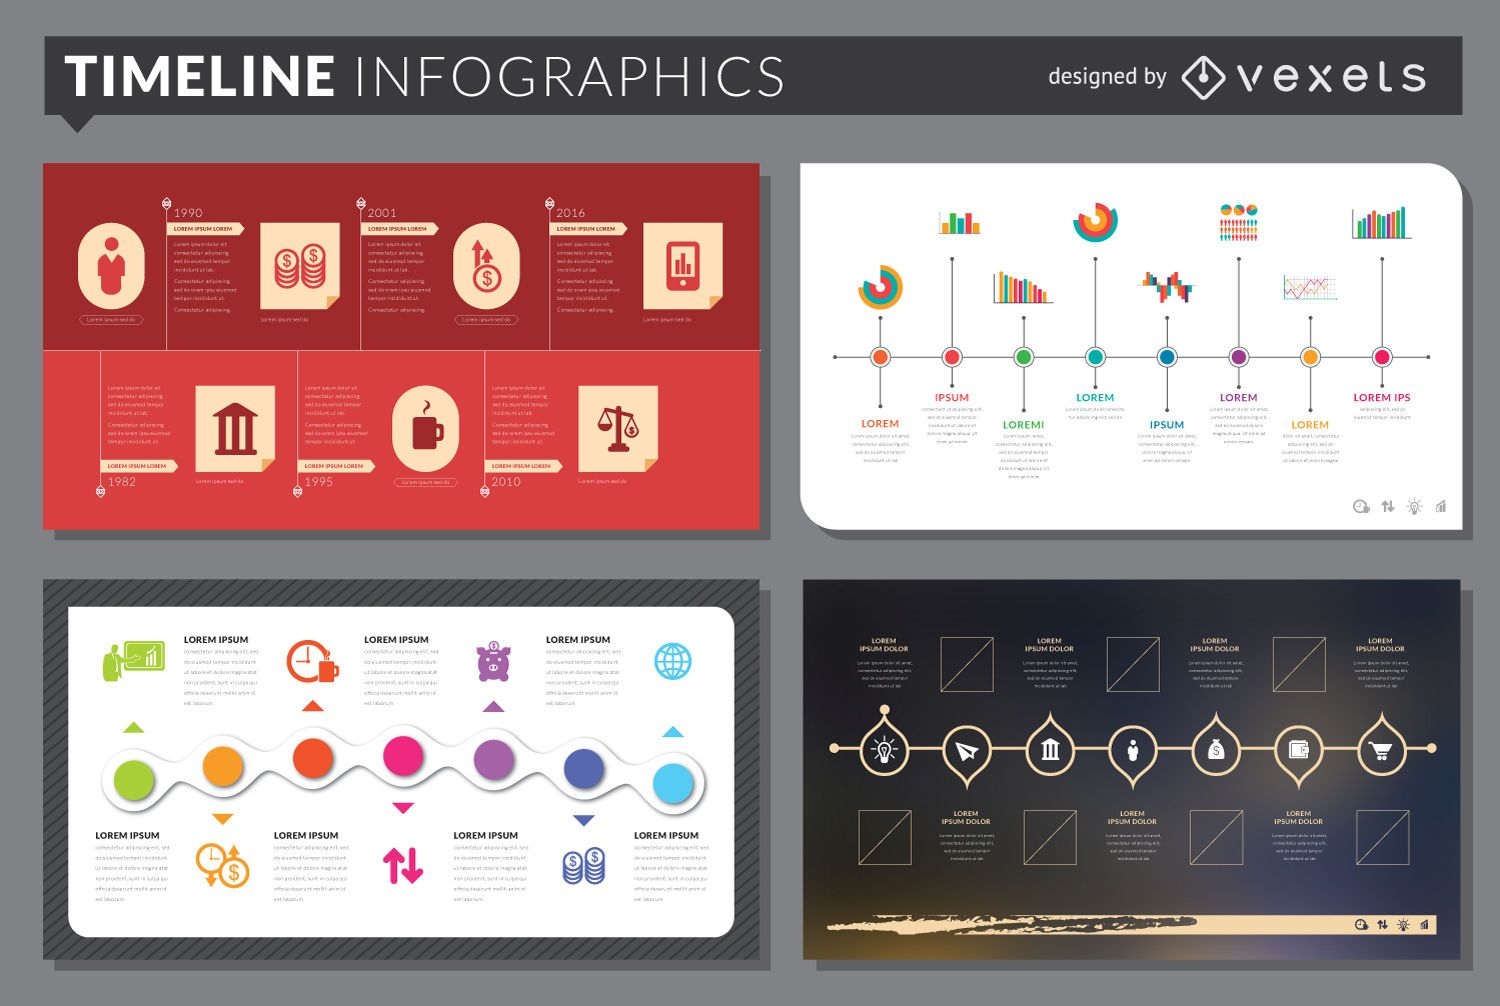
Timeline infographic template set
Choose a folder
All favorites
Create new
Save
Timeline infographic template set
Print ready
for Merch
Money businessman t-shirt design
Choose a folder
All favorites
Create new
Save
Money businessman t-shirt design
Editable text
Premium
Covid-19 infographic elements
Choose a folder
All favorites
Create new
Save
Covid-19 infographic elements
Editable Slides
Premium
Abstract Organic Presentation Template
Choose a folder
All favorites
Create new
Save
Abstract Organic Presentation Template
Editable Slides
Premium
Technical School Presentation Template
Choose a folder
All favorites
Create new
Save
Technical School Presentation Template
Editable Slides
Premium
Minimal Business Presentation Template
Choose a folder
All favorites
Create new
Save
Minimal Business Presentation Template
Graph & Chart Circles Icon Pack
Choose a folder
All favorites
Create new
Save
Graph & Chart Circles Icon Pack
Editable Slides
Premium
World Travel Presentation Template
Choose a folder
All favorites
Create new
Save
World Travel Presentation Template
Editable Slides
Premium
Creative Flow Presentation Template
Choose a folder
All favorites
Create new
Save
Creative Flow Presentation Template
Editable Slides
Premium
Abstract Tech Presentation Template
Choose a folder
All favorites
Create new
Save
Abstract Tech Presentation Template
Editable Slides
Premium
Simple Floral Presentation Template
Choose a folder
All favorites
Create new
Save
Simple Floral Presentation Template
Editable Slides
Premium
Floral Love Presentation Template
Choose a folder
All favorites
Create new
Save
Floral Love Presentation Template
Editable Slides
Premium
Modern Tech Presentation Template
Choose a folder
All favorites
Create new
Save
Modern Tech Presentation Template
Editable Slides
Premium
Coffee Presentation Template
Choose a folder
All favorites
Create new
Save
Coffee Presentation Template
Vector Icons
Choose a folder
All favorites
Create new
Save
Vector Icons
Editable Slides
Premium
Modern Educational Presentation Template
Choose a folder
All favorites
Create new
Save
Modern Educational Presentation Template
Editable Slides
Premium
Modern Gradient Presentation Template
Choose a folder
All favorites
Create new
Save
Modern Gradient Presentation Template
Editable Template
Premium
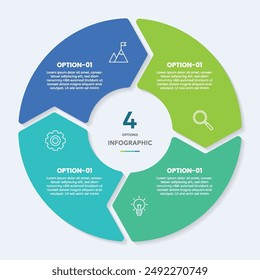
Infographic abstract template
Choose a folder
All favorites
Create new
Save
Infographic abstract template
Editable Slides
Premium
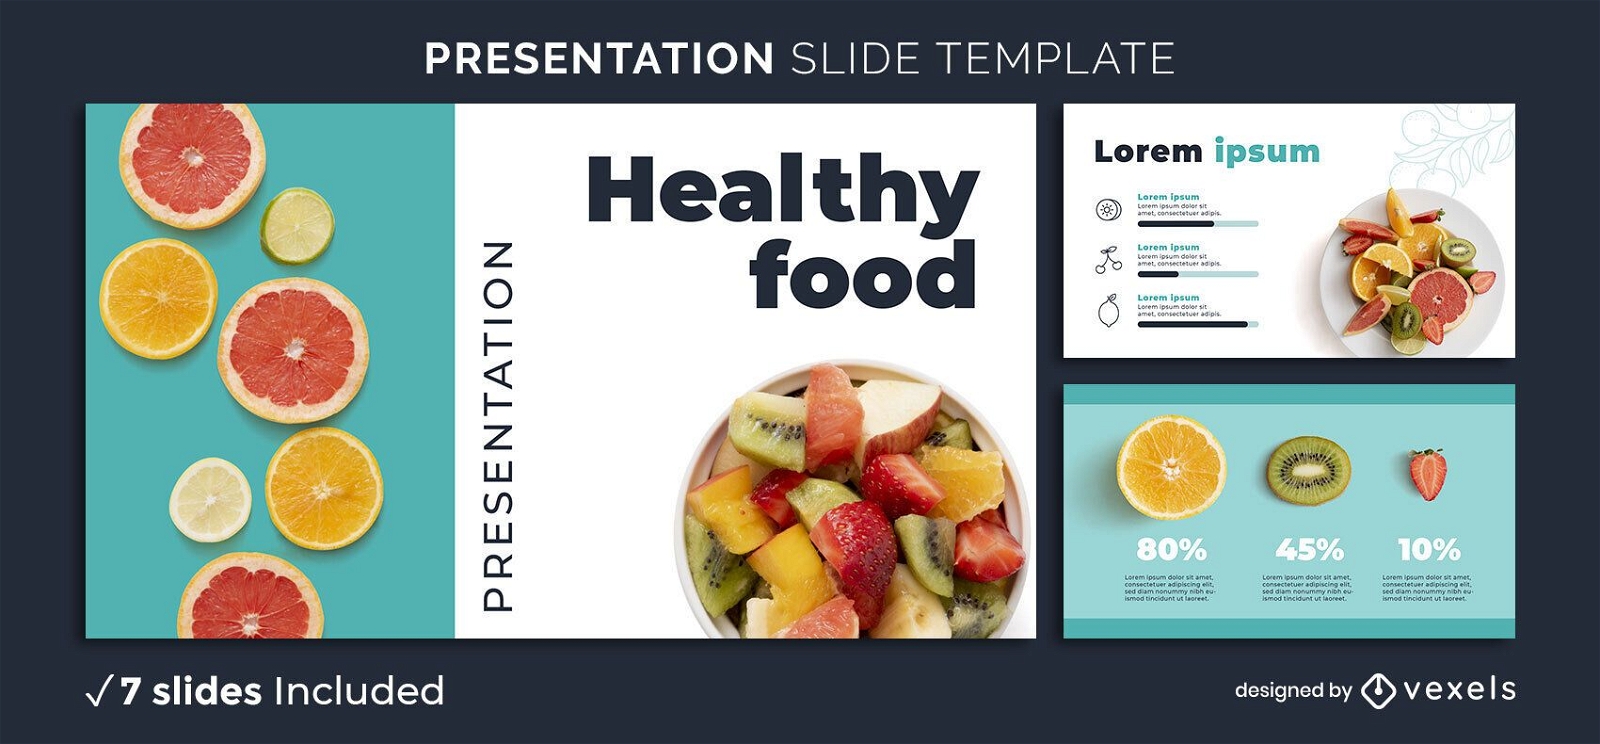
Healthy Citrus Presentation Template
Choose a folder
All favorites
Create new
Save
Healthy Citrus Presentation Template
Editable Slides
Premium
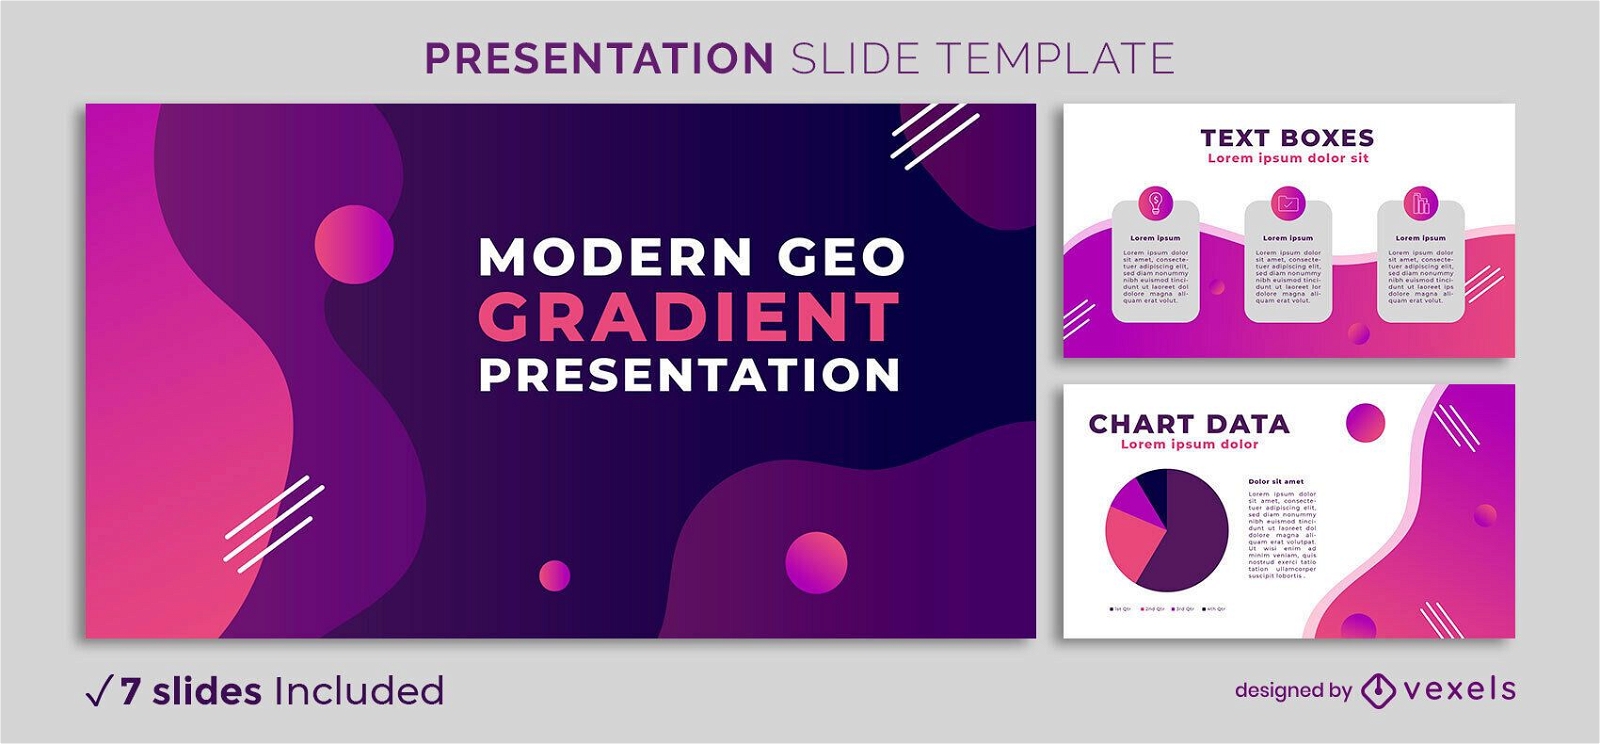
Modern Geo Gradient Presentation Template
Choose a folder
All favorites
Create new
Save
Modern Geo Gradient Presentation Template
Editable text
Premium
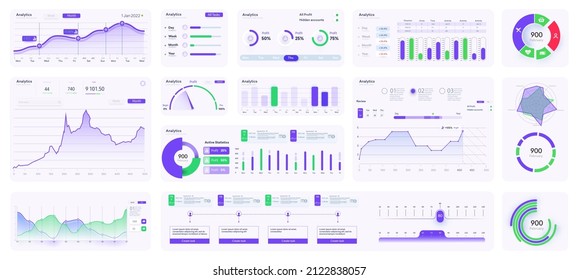
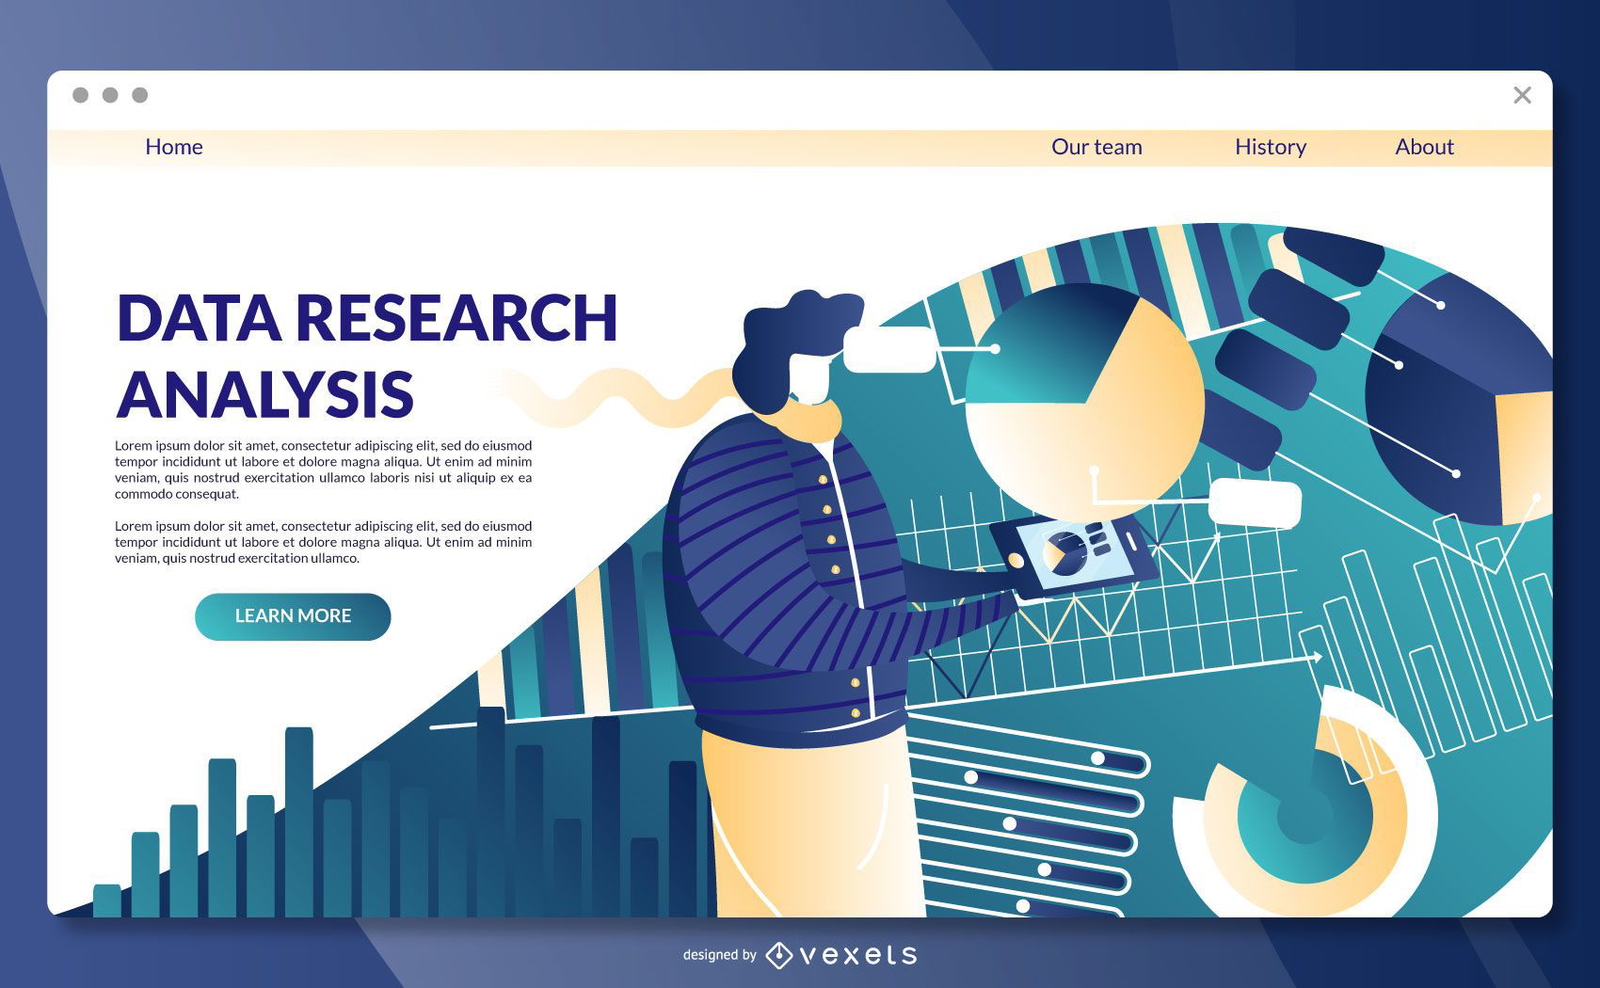
Data research landing page template
Choose a folder
All favorites
Create new
Save
Data research landing page template
Premium
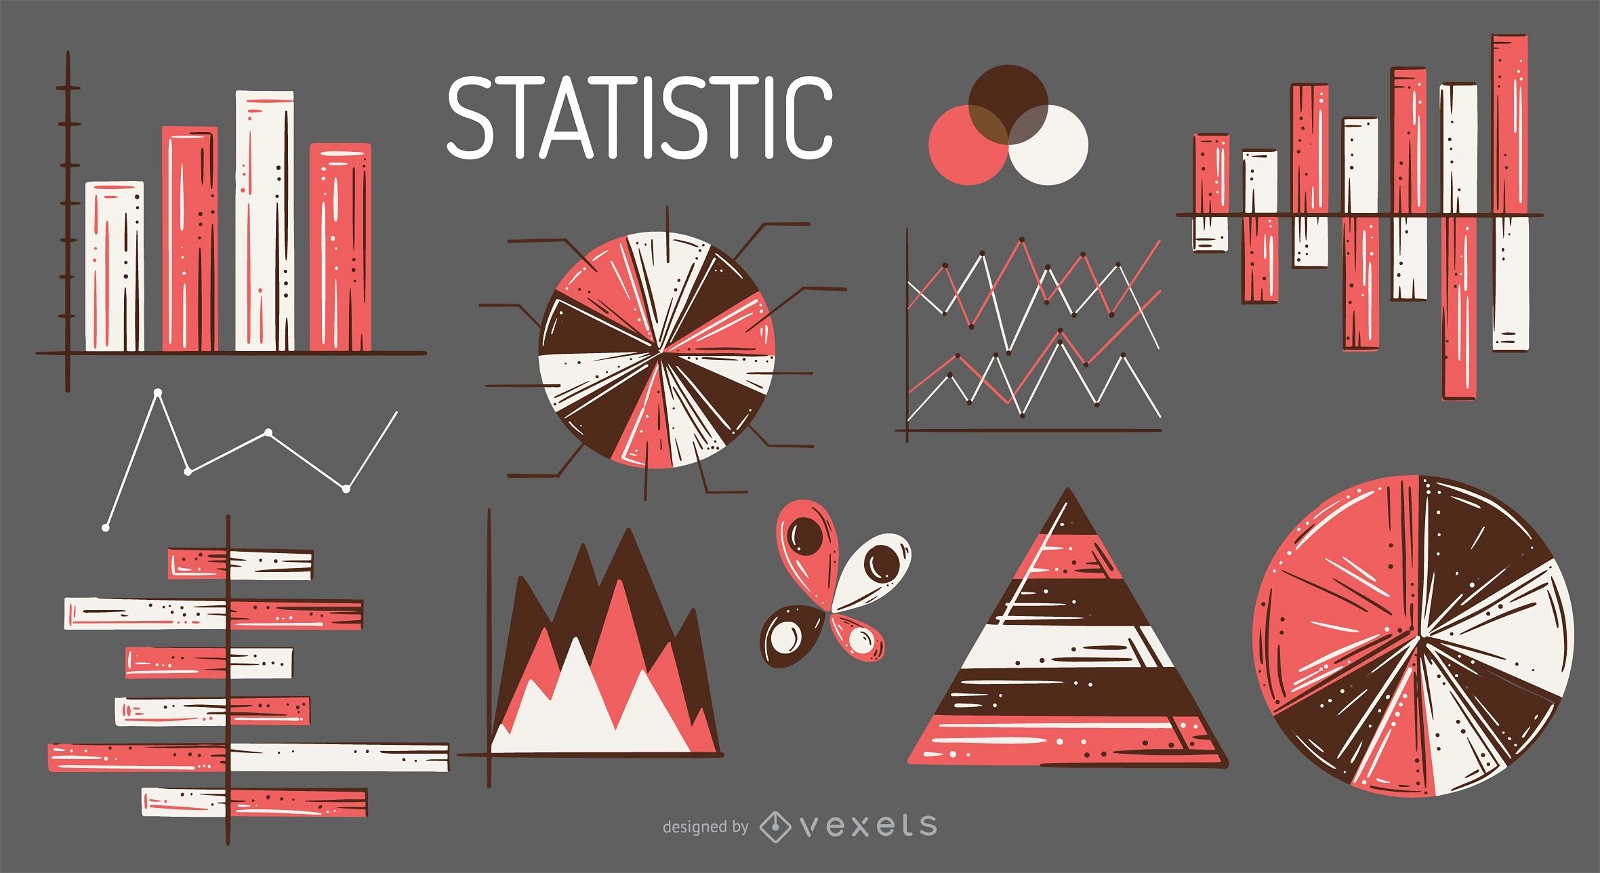
Statistic elements illustration set
Choose a folder
All favorites
Create new
Save
Statistic elements illustration set
Editable Slides
Premium
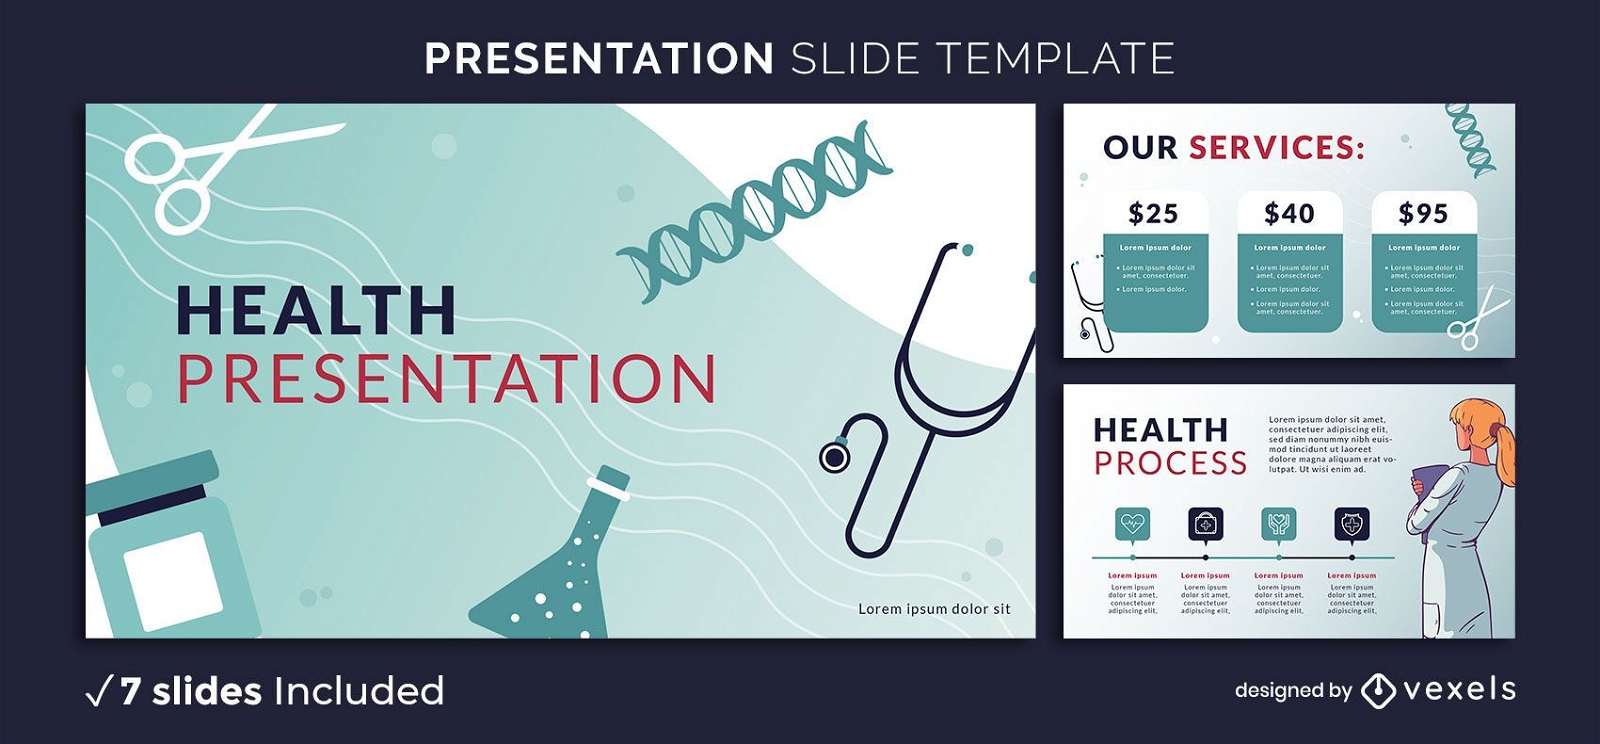
Health Presentation Template
Choose a folder
All favorites
Create new
Save
Health Presentation Template
Editable Slides
Premium
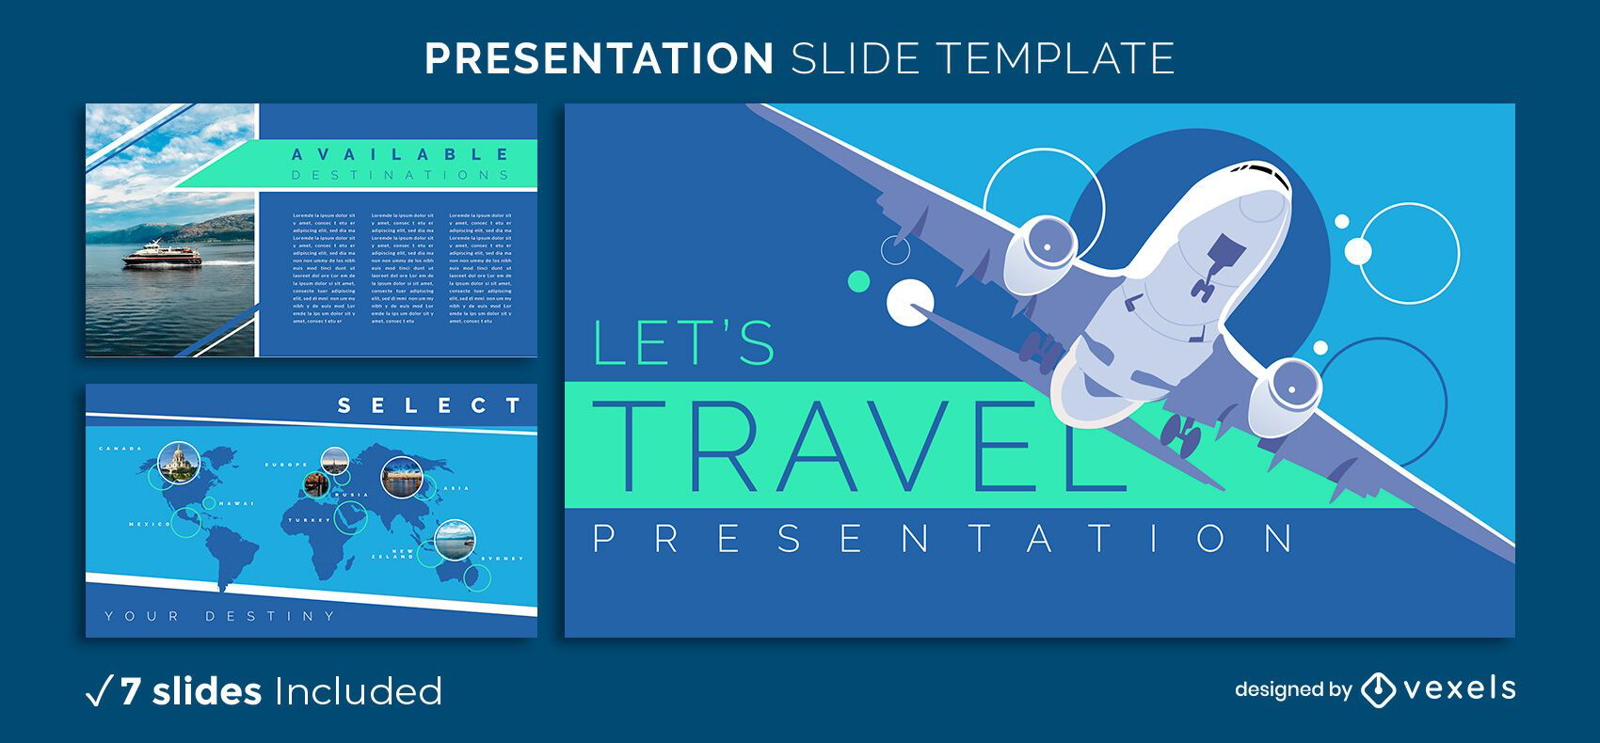
Travel Presentation Template
Choose a folder
All favorites
Create new
Save
Travel Presentation Template
Editable Slides
Premium
Medical Health Presentation Template
Choose a folder
All favorites
Create new
Save
Medical Health Presentation Template
Editable Slides
Premium
Team Characters Presentation Template
Choose a folder
All favorites
Create new
Save
Team Characters Presentation Template
Editable Slides
Premium
Abstract Geometric Presentation Template
Choose a folder
All favorites
Create new
Save
Abstract Geometric Presentation Template
Editable Slides
Premium
Gradient Flow Presentation Template
Choose a folder
All favorites
Create new
Save
Gradient Flow Presentation Template
Editable Slides
Premium
Minimal B&W Presentation Template
Choose a folder
All favorites
Create new
Save
Minimal B&W Presentation Template
Editable Slides
Premium
Summer Presentation Template
Choose a folder
All favorites
Create new
Save
Summer Presentation Template
Editable Slides
Premium
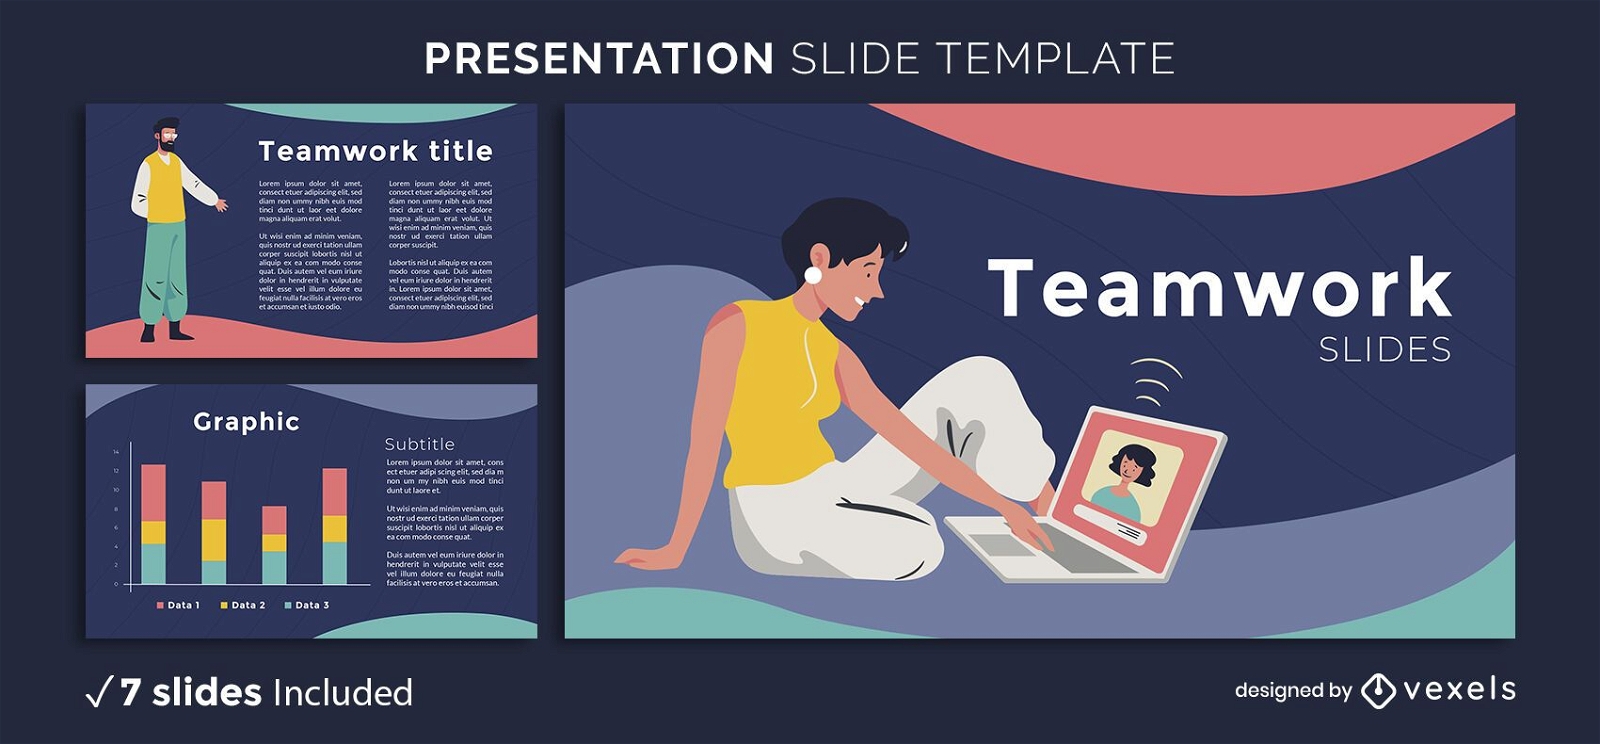
Teamwork Presentation Template
Choose a folder
All favorites
Create new
Save
Teamwork Presentation Template
Editable Slides
Premium
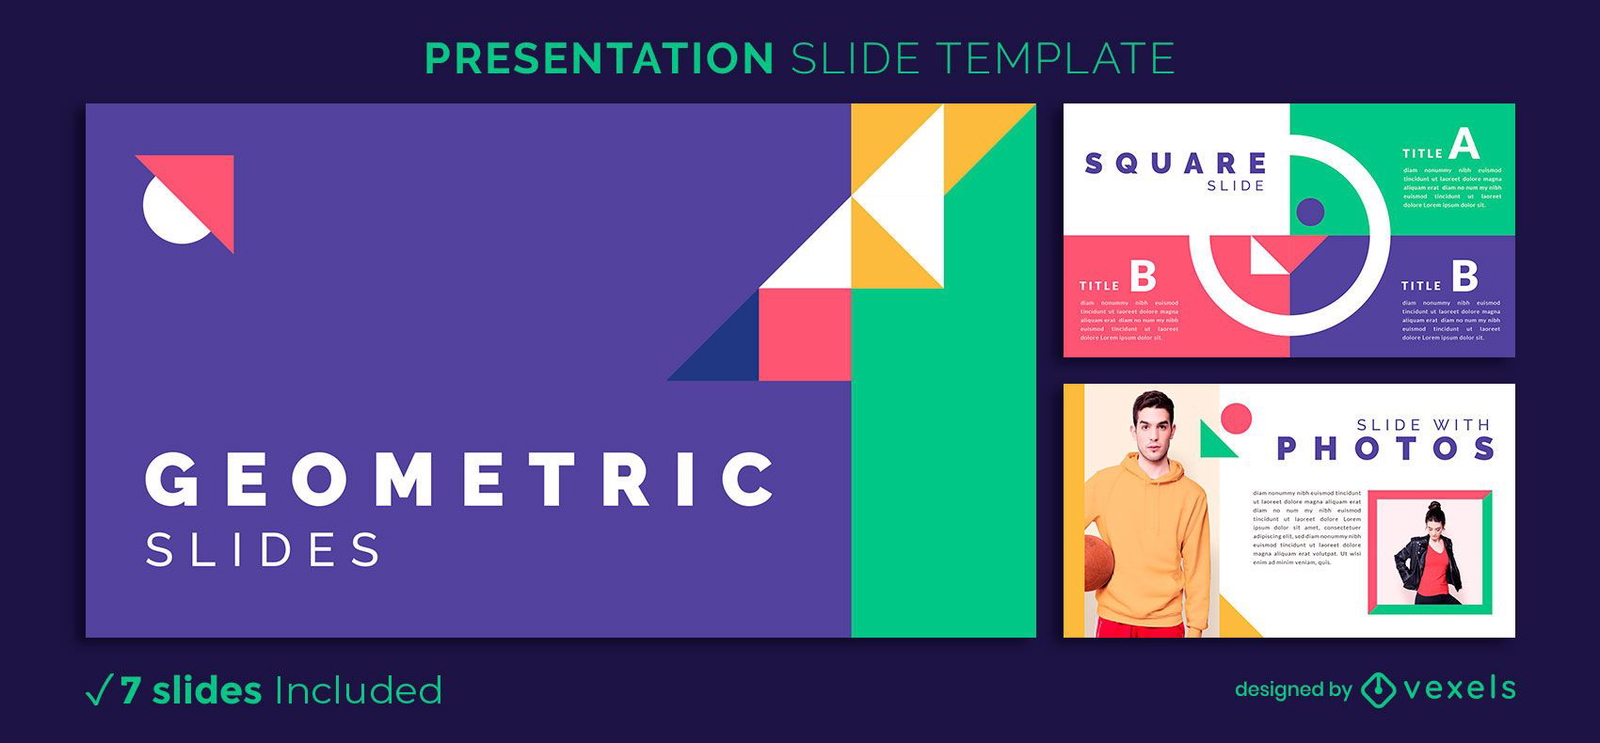
Bright Geometric Presentation Template
Choose a folder
All favorites
Create new
Save
Bright Geometric Presentation Template
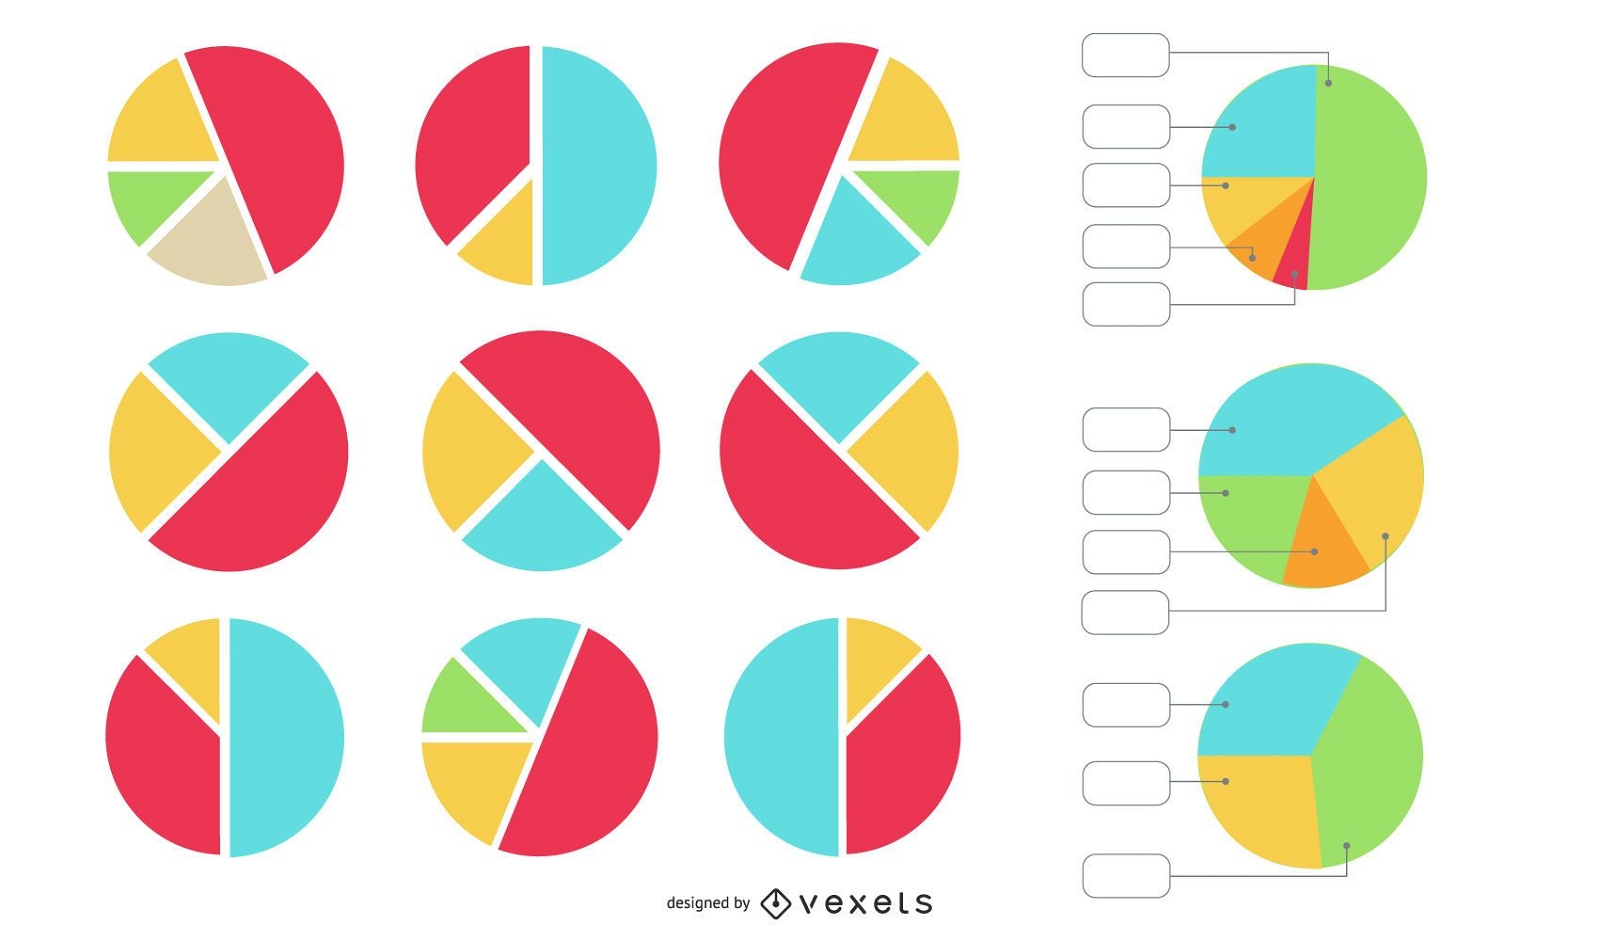
Pie Chart Vector Set
Choose a folder
All favorites
Create new
Save
Pie Chart Vector Set
Finance Investment Icons
Choose a folder
All favorites
Create new
Save
Finance Investment Icons
Finance department icon set
Choose a folder
All favorites
Create new
Save
Finance department icon set
Boost Your Business
With The Leading Graphic Platform For Merch.
SEE PLANS
of 2
prev page
next page