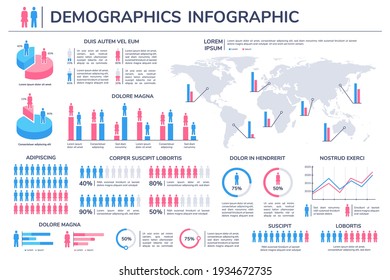
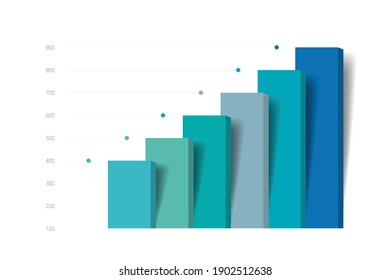
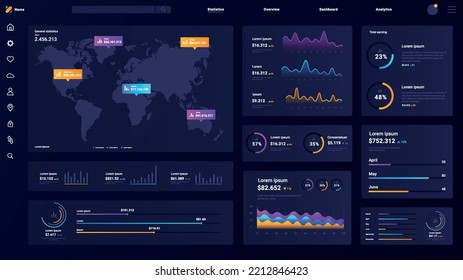
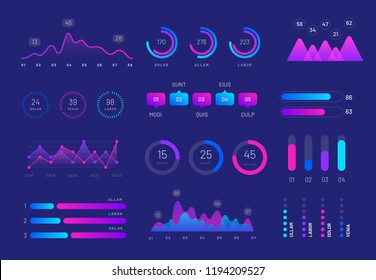
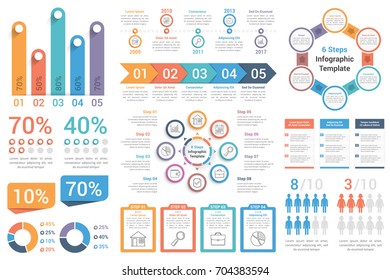
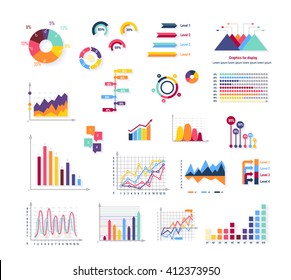
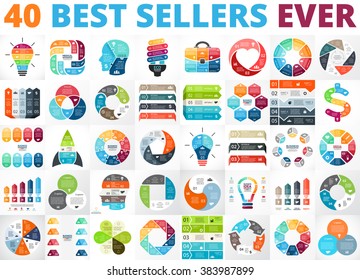
76 graphs designs graphics for t-shirt and print on demand merch

Download graphs t-shirt designs and other merch graphics like book covers, phone cases, tote bags and more.

Sort by

Most relevant
Vector illustration, workers are sitting at the negotiating table, collective thinking and brainstorming,  vector, company information analytics
Infographic design template. Creative concept with 4 steps. Can be used for workflow layout, diagram, banner, webdesign. Vector illustration
Sales forecasting abstract concept vector illustration. Business strategy planning, marketing forecasting method, sales software, revenue management, retail income, profit plan abstract metaphor.
Modern infographic vector elements for business brochures. Use in website, corporate brochure, advertising and marketing. Pie charts, line graphs, bar graphs and timelines.
Business candle stick graph chart of stock market investment trading, Bullish point, Bearish point. trend of graph vector design.
Big set of vector infographic elements with maps and icons.
People interacting with charts and analyzing statistics. Data visualization concept. 3d isometric vector illustration.
Big data analysis, computer processing visualisation, business analytics
Exponential growth or compound interest 3D. Business sales, investment, wealth or earning rising up graph profit increase concept, financial report graph with exponential arrow from flying rocket 3D
Graph Paper
Business data graphs. Vector financial and marketing charts. Illustration of data financial graph and diagram
Concept business strategy. Analysis data and Investment. Business success.Financial review with laptop and infographic elements. 3d isometric flat design. Vector illustration.
Business growth, investment profit increase, growing fast or improvement sales and revenue, progress or development concept, businessman riding rocket on growth bar graph or rising up revenue chart.
Bundle infographic elements data visualization vector design template. Can be used for steps, business processes, workflow, diagram, flowchart concept, timeline, marketing icons, info graphics.
Analyzing business data, Business data analytics, Analytics and research, Financial reports and investments, SEO analytics optimization, company financial evaluation,
Widescreen Abstract financial graph with uptrend line and bar chart of stock market on blue color background
man searching for path to success. exploring horizons goal setting and development guide. people standing on profit and profit arrows, growth chart look great telescope spyglass in search of new ideas
Financial data graph chart, vector illustration. Trend lines, columns, market economy information background. Chart analytics economic concept.
Infographics elements diagram with 6 steps, options, Vector illustration, Rectangular 3d icon, presentation,  advertisment, Process chart, business flyer, banner design, web design, timeline, silde
success market graph and stock currency technology. Growth Graph business digital investment. exchange financial trading forex. income economy and candlestick. vector illustration digital fantastic.
Vector circle arrows infographic, cycle diagram, graph, presentation chart. Business concept with 3 options, parts, steps, processes. 16x9 slide template.
modern infographics template, options, steps, rows, column, graph / infographics table background
Organizing Accounting, Financial, Banking Data. Tiny Accountant Characters around of Huge Clip Board Filling Bookkeeping Graphs and Charts Counting Debit and Credit. Cartoon People Vector Illustration
Business candle stick graph chart of stock market investment trading on white background design. Bullish point, Trend of graph. Vector illustration
Infographic presentation 5 years of data company. Infographic 5 options. An infographic showing company growth. Vector Illustration.
Sales growth abstract concept vector illustration. Profit plan, client database growth, sales manager, promotion method, marketing goal, salesman achievement, rate formula abstract metaphor.
Population infographic. Women and men percentage world statistic. Charts, graphs and diagram element. Human demographic vector information
Chart, column graph, infographic element.
Dashboard analitiucs panel. Infographics, interface for programs and applications. Modern technologies and digital world. UI and UX design software, statistics. Cartoon flat vector illustration
Business candle stick graph chart of stock market investment trading on dark background design. Bullish point, Trend of graph. Vector illustration
Intelligent technology vector interface for presentation. Network management data screen with colored charts. Interface screen with infographic digital illustration.
3D infographic element, or graph with four (4) steps .
Dashboard infographic template with modern design annual statistics graphs. Pie charts, workflow, web design, UI elements. Vector EPS 10
Economic graph with diagrams on the stock market, for business and financial concepts and reports.Abstract blue vector background
Dashboard infographic template with flat design graphs, charts, UI elements. Admin panel interface. Vector illustration
Graph going Up and Down sign with green and red arrows vector. Flat design vector illustration concept of sales bar chart symbol icon with arrow moving down and sales bar chart with arrow moving up.
Statistics - line icon set with editable stroke. Collection of 20 graphs, charts, diagrams... Infographics, data analysis, stats tools. Isolated on white background. Vector illustration.
Financial polygonal diagram with ascending graphs on white background with numbers.
Intelligent infographic technology UI interface. Vector network management data screen with colored charts, diagrams with steps, options, parts processes. Interface template digital illustration
Chart, graph. Infographic.
Grow business increase sales and profit, growth or progress to achieve goal and target, improve or development to boost performance concept, business people team looking at high rising up graph arrow.
Growth bar chart icon, simple vector illustration isolated black background
Vector graph or chart of box and whisker plot for the standard normal distribution isolated on white. Probability density function of a normal distribution or population with boxplot above the graph.
Financial themed background, with bar chart and arrows with an upward trend on blue tones.
Grid on a white background, vector illustration
Set of most useful infographic elements - bar graphs, human infographics, pie charts, steps and options, workflow, percents, circle diagrams, timeline, vector eps10 illustration
Data tools finance diagram and graphic. Chart and graphic, business diagram data finance, graph report, information data statistic, infographic analysis tools vector illustration
Vector circle infographics. Business diagrams, arrows graphs, presentations, idea cycle charts. Data options, parts, 3, 4, 5, 6, 7, 8 steps infographic. Bulb, brain, plus, eco, heart, lines, stairs.
Elements of infographics on a dark background. Use in presentation templates, flyer and leaflet, corporate report. Dashboard template with big data visualization.
Vector circle arrows for infographic. Template for cycling diagram, graph, presentation and round chart. Business concept with 3, 4, 5, 6, 7, 8 options, parts, steps or processes. Abstract background.
Sponsored results by Shutterstock Logo
Get 15% off with code: VEXELS15

of 2