Design Library
Explore Designs
New Merch Designs
Trending Merch Designs
Vectors
PNGs & SVGs
Mockups
T-Shirts
T-Shirt PSD Templates
KDP Designs
Phone Cases
Pillows
Tote Bags
Posters
Mugs
Design Tools
Designer
New!
T-shirt Maker
Mockup Generator
Quote Generator
Logo Maker
Resources
Merch Digest
Blog
Help Center
Creators Program
Learn About Merch
Changelog
Pricing
Loading...
Sign Up
Login
All
line
graph
Design Library
Explore Designs
New Merch Designs
Trending Merch Designs
Vectors
PNGs & SVGs
Mockups
T-Shirts
T-Shirt PSD Templates
KDP Designs
Phone Cases
Pillows
Tote Bags
Posters
Mugs
Design Tools
Designer
New!
T-shirt Maker
Mockup Generator
Quote Generator
Logo Maker
Resources
Merch Digest
Blog
Help Center
Creators Program
Learn About Merch
Changelog
PLANS
All
line
graph
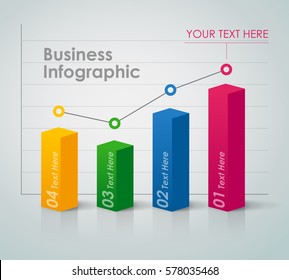
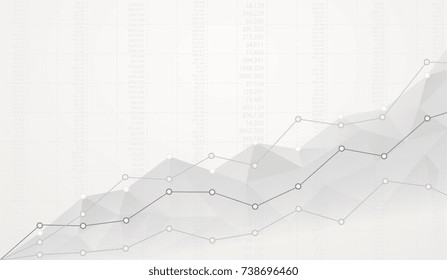
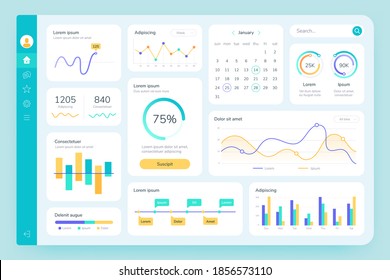
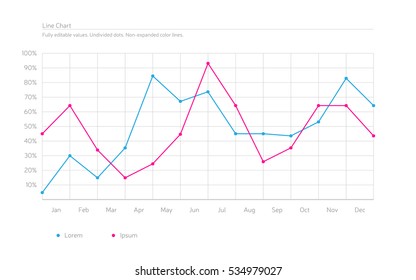
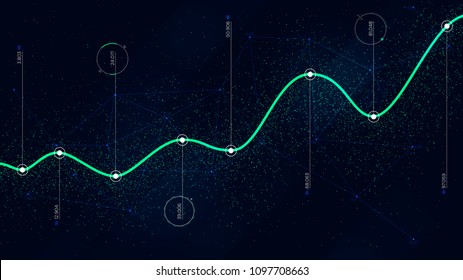
61 line graph designs graphics for t-shirt and print on demand merch
Download line graph t-shirt designs and other merch graphics like book covers, phone cases, tote bags and more.
Sort by
Most relevant
Sponsored results by
Get 15% off with code: VEXELS15
Show more
Edit in T-shirt Maker
Punk cat skateboarding editable t-shirt template
Edit in T-shirt Maker
Viking warrior editable t-shirt template
Edit in T-shirt Maker
Fantasy horse editable t-shirt template
Edit in T-shirt Maker
Camping bear editable t-shirt template
Edit in T-shirt Maker
Street cat editable t-shirt template
Edit in T-shirt Maker
Cool black cat editable t-shirt template
Edit in T-shirt Maker
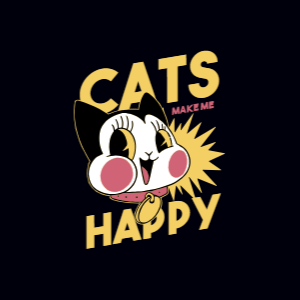
Cartoon happy cat editable t-shirt template
Edit in T-shirt Maker
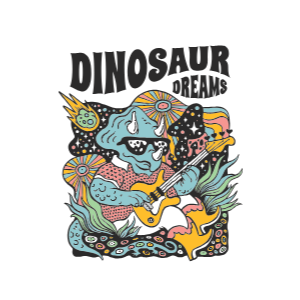
Trippy dinosaur editable t-shirt template
Edit in T-shirt Maker
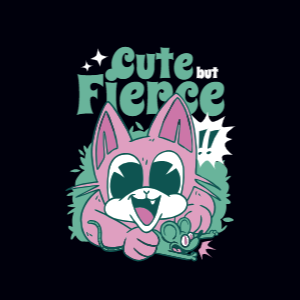
Cute cat editable t-shirt template
Edit in T-shirt Maker
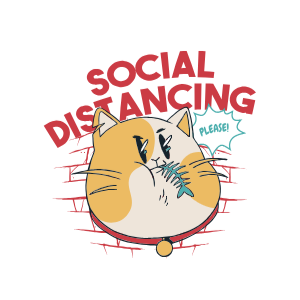
Social distancing cat editable t-shirt template
Edit in T-shirt Maker
Surf skeleton editable t-shirt template
Edit in T-shirt Maker
Eyed mushroom editable t-shirt template
Edit in T-shirt Maker
Flowers time quote editable t-shirt template
Edit in T-shirt Maker
Bloom and blossom editable t-shirt template
Edit in T-shirt Maker
Floral Fantasy editable t-shirt template
Edit in T-shirt Maker
Jack o lantern editable t-shirt template
Edit in T-shirt Maker
Beer monster editable t-shirt template
Edit in T-shirt Maker
Beer vintage lettering editable t-shirt template
Edit in T-shirt Maker
Awesome beer glass editable t-shirt template
Edit in T-shirt Maker
Beer text editable t-shirt template
Boost Your Business
With The Leading Graphic Platform For Merch.
SEE PLANS
of 2
prev page
next page