Design Library
Explore Designs
New Merch Designs
Trending Merch Designs
Vectors
PNGs & SVGs
Mockups
T-Shirts
T-Shirt PSD Templates
KDP Designs
Phone Cases
Pillows
Tote Bags
Posters
Mugs
Design Tools
Designer
New!
T-shirt Maker
Mockup Generator
Quote Generator
Logo Maker
Resources
Merch Digest
Blog
Help Center
Creators Program
Learn About Merch
Changelog
Pricing
Loading...
Sign Up
Login
All
line
graph
Design Library
Explore Designs
New Merch Designs
Trending Merch Designs
Vectors
PNGs & SVGs
Mockups
T-Shirts
T-Shirt PSD Templates
KDP Designs
Phone Cases
Pillows
Tote Bags
Posters
Mugs
Design Tools
Designer
New!
T-shirt Maker
Mockup Generator
Quote Generator
Logo Maker
Resources
Merch Digest
Blog
Help Center
Creators Program
Learn About Merch
Changelog
PLANS
All
line
graph
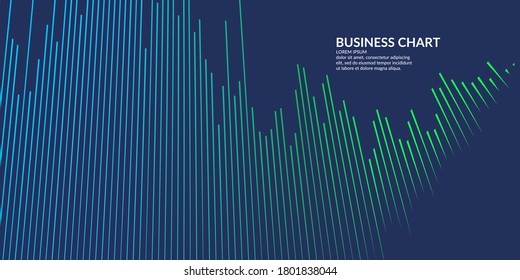
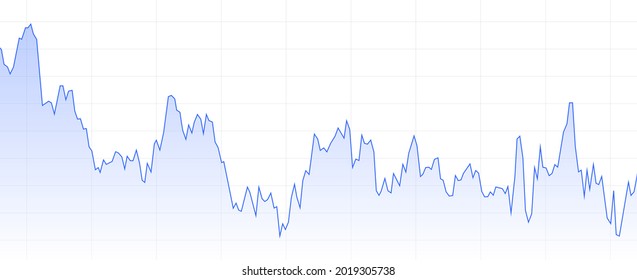
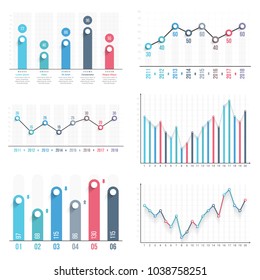
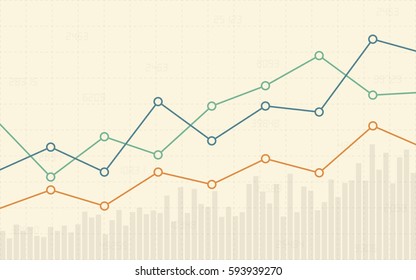
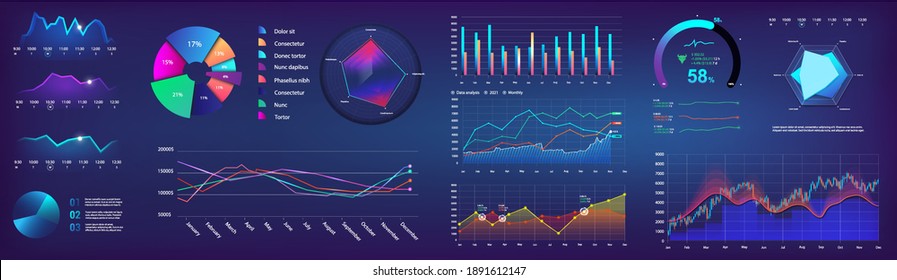
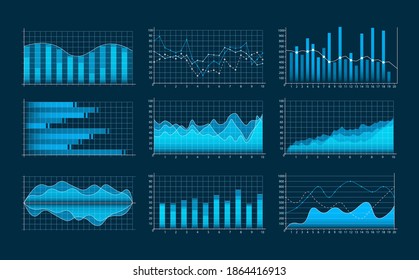
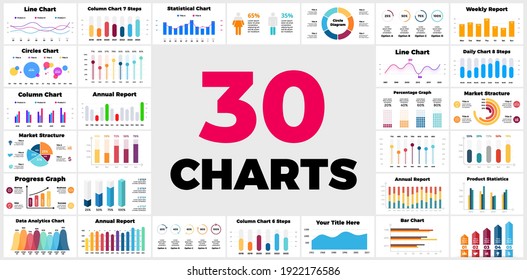
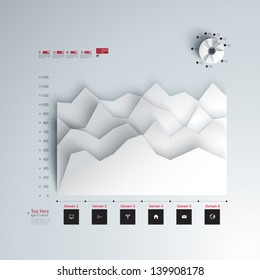
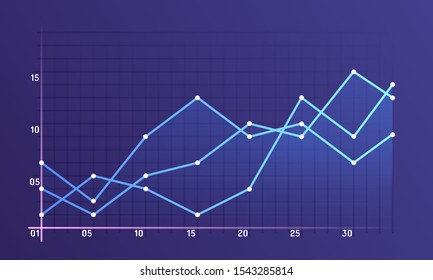
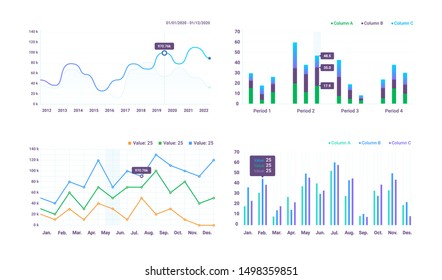
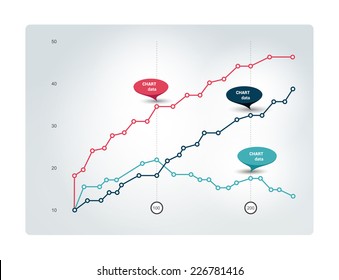
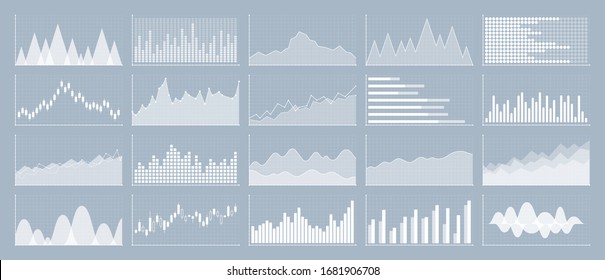
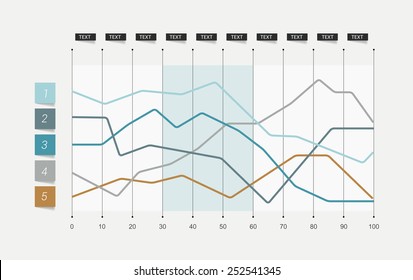
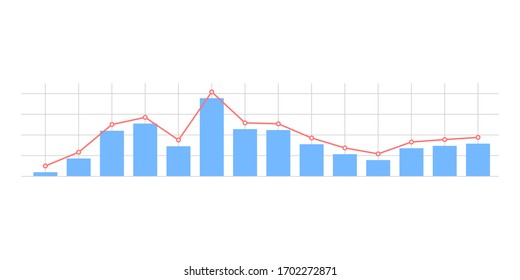
61 line graph designs graphics for t-shirt and print on demand merch
Download line graph t-shirt designs and other merch graphics like book covers, phone cases, tote bags and more.
Sort by
Most relevant
Sponsored results by
Get 15% off with code: VEXELS15
Show more
Edit in T-shirt Maker
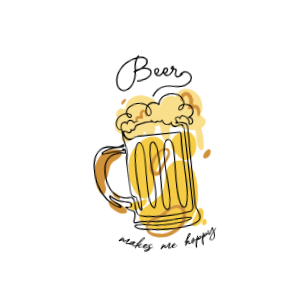
Beer continuous line editable t-shirt template
Edit in T-shirt Maker
Beer season vintage editable t-shirt template
Edit in T-shirt Maker
Beer Castle editable t-shirt template
Edit in T-shirt Maker
Beer loading bar editable t-shirt template
Edit in T-shirt Maker
Beer glass badge editable t-shirt design template
Edit in T-shirt Maker
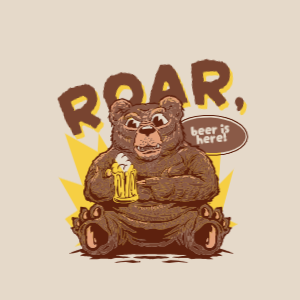
Beer bear editable t-shirt template
Edit in T-shirt Maker
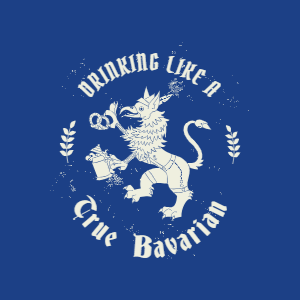
Bavarian drinkning t-shirt design
Edit in T-shirt Maker
Beer with skull editable t-shirt template
Edit in T-shirt Maker
Beer skeleton hand editable t-shirt design
Edit in T-shirt Maker
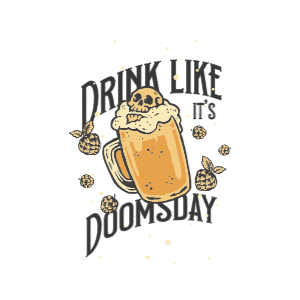
Beer lettering editable t-shirt template
Edit in T-shirt Maker
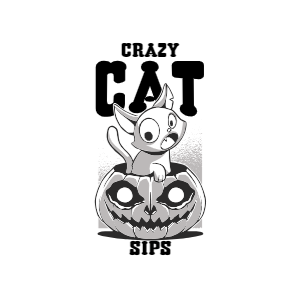
Pumpkin cat character t-shirt template
Edit in T-shirt Maker
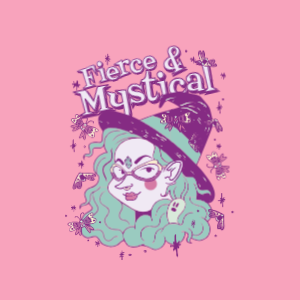
Fierce witch editable t-shirt template
Edit in T-shirt Maker
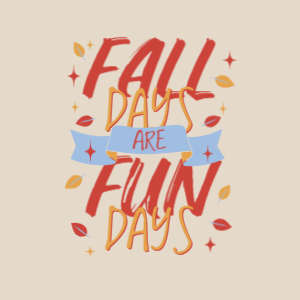
Fall days editable t-shirt design template
Edit in T-shirt Maker
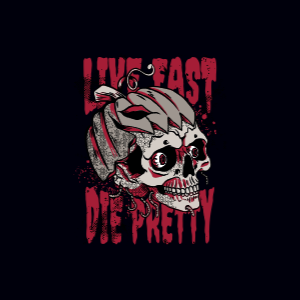
Horror skull editable t-shirt template
Edit in T-shirt Maker
Zombie hand halloween editable t-shirt design template
Edit in T-shirt Maker
Scary zombie pumpkin editable t-shirt design template
Edit in T-shirt Maker
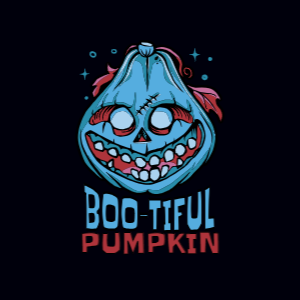
Pumpkin smiles editable t-shirt template
Edit in T-shirt Maker
Pumpkin harvest editable t-shirt template
Edit in T-shirt Maker
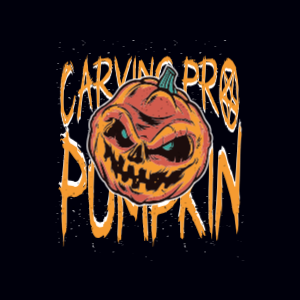
Pumpkin carving editable t-shirt design template
Edit in T-shirt Maker
Pumpkin head editable t-shirt template
Boost Your Business
With The Leading Graphic Platform For Merch.
SEE PLANS
of 2
prev page
next page