Design Library
Explore Designs
New Merch Designs
Trending Merch Designs
Vectors
PNGs & SVGs
Mockups
T-Shirts
T-Shirt PSD Templates
KDP Designs
Phone Cases
Pillows
Tote Bags
Posters
Mugs
Design Tools
Designer
New!
T-shirt Maker
Mockup Generator
Quote Generator
Logo Maker
Resources
Merch Digest
Blog
Help Center
Creators Program
Learn About Merch
Changelog
Pricing
Loading...
Sign Up
Login
PNGs For Merch
chart
Design Library
Explore Designs
New Merch Designs
Trending Merch Designs
Vectors
PNGs & SVGs
Mockups
T-Shirts
T-Shirt PSD Templates
KDP Designs
Phone Cases
Pillows
Tote Bags
Posters
Mugs
Design Tools
Designer
New!
T-shirt Maker
Mockup Generator
Quote Generator
Logo Maker
Resources
Merch Digest
Blog
Help Center
Creators Program
Learn About Merch
Changelog
PLANS
PNGs For Merch
chart
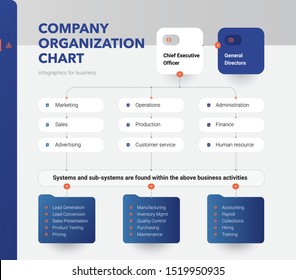
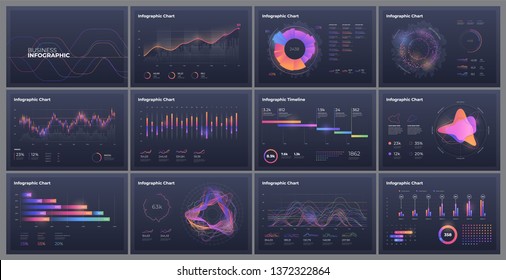
276 chart PNG and SVG design graphic
Download chart PNG & SVG Designs with transparent background for T-Shirts, book covers, phone cases and other merch.
Related:
charts
,
pie chart
,
pie charts
Sort by
Most relevant
Sponsored results by
Get 15% off with code: VEXELS15
Show more
Premium
Half grey colorful piechart PNG Design
Choose a folder
All favorites
Create new
Save
Half grey colorful piechart PNG Design
Premium
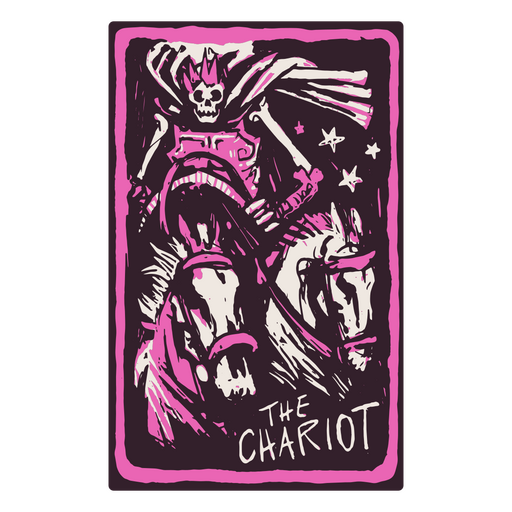
The Chariot card in a skeleton-themed tarot PNG Design
Choose a folder
All favorites
Create new
Save
The Chariot card in a skeleton-themed tarot PNG Design
Premium
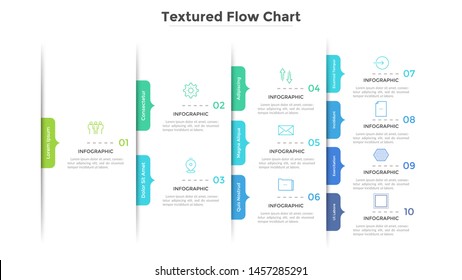
Graph elliptical sticker infographic PNG Design
Choose a folder
All favorites
Create new
Save
Graph elliptical sticker infographic PNG Design
Premium
Aquarius sign in the western horoscope PNG Design
Choose a folder
All favorites
Create new
Save
Aquarius sign in the western horoscope PNG Design
Premium
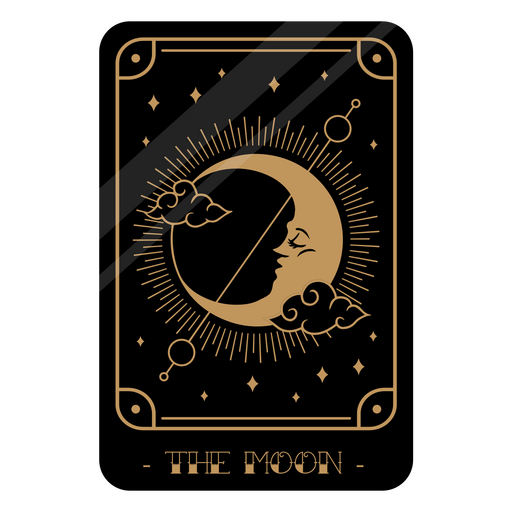
Moon card illuminating the unknown PNG Design
Choose a folder
All favorites
Create new
Save
Moon card illuminating the unknown PNG Design
Premium
Decorative moon design PNG Design
Choose a folder
All favorites
Create new
Save
Decorative moon design PNG Design
Premium
Graph tv circle icon PNG Design
Choose a folder
All favorites
Create new
Save
Graph tv circle icon PNG Design
Premium
Taurus sign in the horoscope PNG Design
Choose a folder
All favorites
Create new
Save
Taurus sign in the horoscope PNG Design
Premium
Tarot card with symbols of the Moon PNG Design
Choose a folder
All favorites
Create new
Save
Tarot card with symbols of the Moon PNG Design
Premium
Two sided colorful bar graph PNG Design
Choose a folder
All favorites
Create new
Save
Two sided colorful bar graph PNG Design
Premium
Sagitarius sign in the horoscope PNG Design
Choose a folder
All favorites
Create new
Save
Sagitarius sign in the horoscope PNG Design
Premium
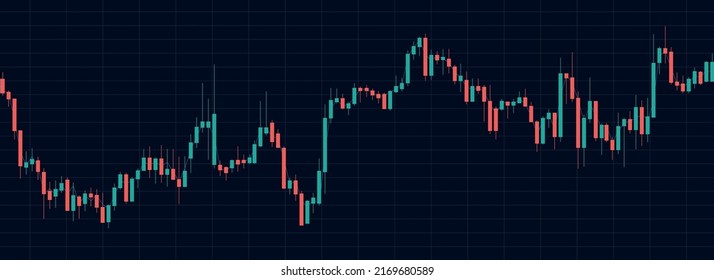
Line graph PNG Design
Choose a folder
All favorites
Create new
Save
Line graph PNG Design
Premium
Multicolor bar graph with icons PNG Design
Choose a folder
All favorites
Create new
Save
Multicolor bar graph with icons PNG Design
Premium
The Wheel of Fortune card in a skeleton-themed tarot PNG Design
Choose a folder
All favorites
Create new
Save
The Wheel of Fortune card in a skeleton-themed tarot PNG Design
Colorful bar graph icon PNG Design
Choose a folder
All favorites
Create new
Save
Colorful bar graph icon PNG Design
Premium
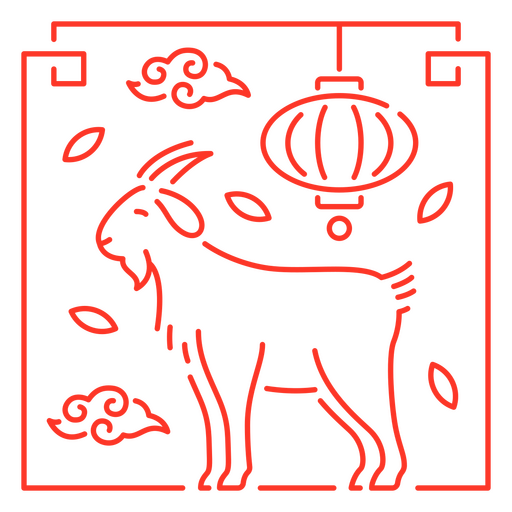
The eastern sign of goat PNG Design
Choose a folder
All favorites
Create new
Save
The eastern sign of goat PNG Design
Premium
Graph square infographic sticker PNG Design
Choose a folder
All favorites
Create new
Save
Graph square infographic sticker PNG Design
Premium
The eastern sign of dog PNG Design
Choose a folder
All favorites
Create new
Save
The eastern sign of dog PNG Design
Premium
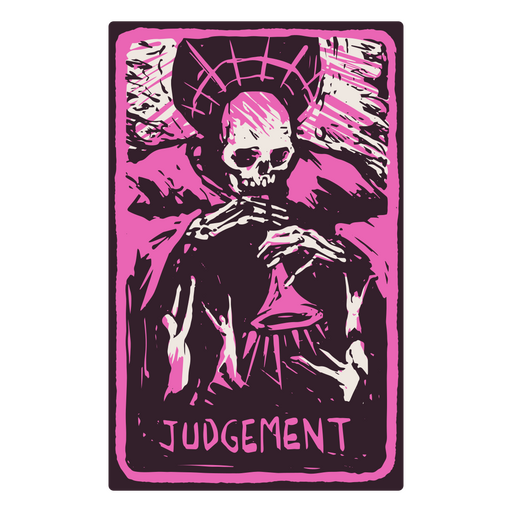
The Judgement card in a skeleton-themed tarot PNG Design
Choose a folder
All favorites
Create new
Save
The Judgement card in a skeleton-themed tarot PNG Design
Premium
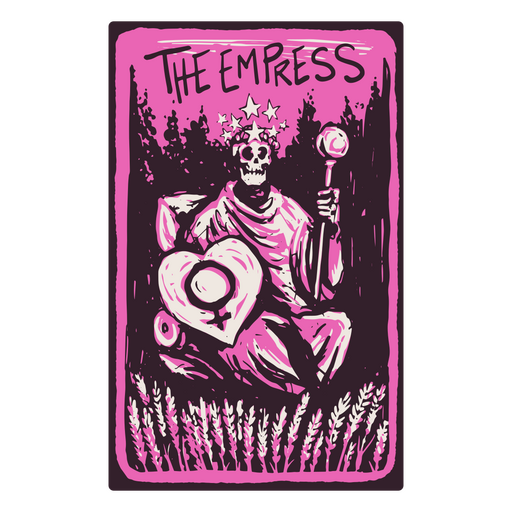
The Empress card in a skeleton-themed tarot PNG Design
Choose a folder
All favorites
Create new
Save
The Empress card in a skeleton-themed tarot PNG Design
Growing graph bars stroke PNG Design
Choose a folder
All favorites
Create new
Save
Growing graph bars stroke PNG Design
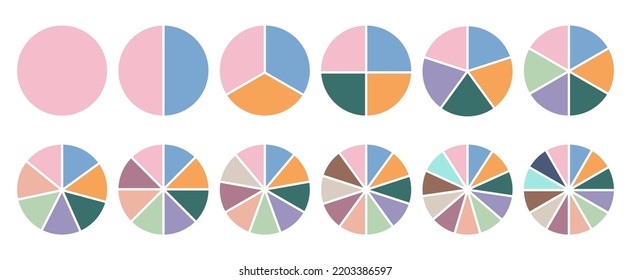
Colorful 4 parts piechart PNG Design
Choose a folder
All favorites
Create new
Save
Colorful 4 parts piechart PNG Design
Premium
The moon card PNG Design
Choose a folder
All favorites
Create new
Save
The moon card PNG Design
Premium
Bar graph square icon PNG Design
Choose a folder
All favorites
Create new
Save
Bar graph square icon PNG Design
Premium
Two sided colorful bar plot PNG Design
Choose a folder
All favorites
Create new
Save
Two sided colorful bar plot PNG Design
Premium
Capricornus sign in the horoscope PNG Design
Choose a folder
All favorites
Create new
Save
Capricornus sign in the horoscope PNG Design
Premium
The lovers tarot card design PNG Design
Choose a folder
All favorites
Create new
Save
The lovers tarot card design PNG Design
Premium
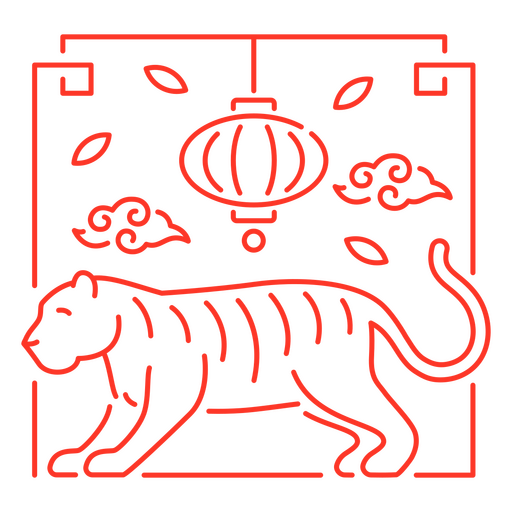
The eastern sign of tiger PNG Design
Choose a folder
All favorites
Create new
Save
The eastern sign of tiger PNG Design
Premium
The eastern zodiac sign of rooster PNG Design
Choose a folder
All favorites
Create new
Save
The eastern zodiac sign of rooster PNG Design
Graph presentation doodle PNG Design
Choose a folder
All favorites
Create new
Save
Graph presentation doodle PNG Design
4 parts piechart infographic PNG Design
Choose a folder
All favorites
Create new
Save
4 parts piechart infographic PNG Design
Premium
Growing graph sign PNG Design
Choose a folder
All favorites
Create new
Save
Growing graph sign PNG Design
Premium
Graph in mobile display PNG Design
Choose a folder
All favorites
Create new
Save
Graph in mobile display PNG Design
Premium
Be wild for a while PNG Design
Choose a folder
All favorites
Create new
Save
Be wild for a while PNG Design
Premium
Graph bubble icon PNG Design
Choose a folder
All favorites
Create new
Save
Graph bubble icon PNG Design
Premium
Growing graph on smartphone icon PNG Design
Choose a folder
All favorites
Create new
Save
Growing graph on smartphone icon PNG Design
Premium
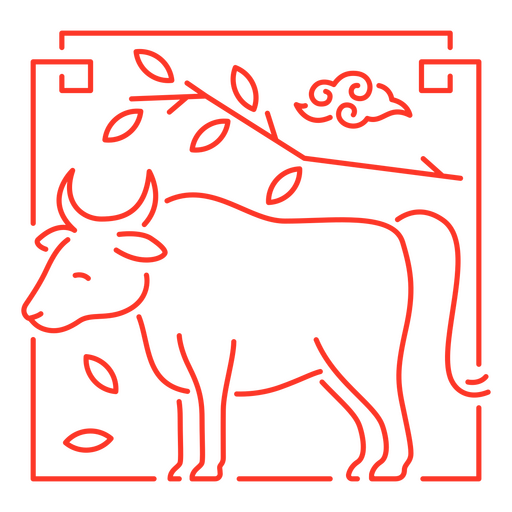
The eastern sign of ox PNG Design
Choose a folder
All favorites
Create new
Save
The eastern sign of ox PNG Design
Premium
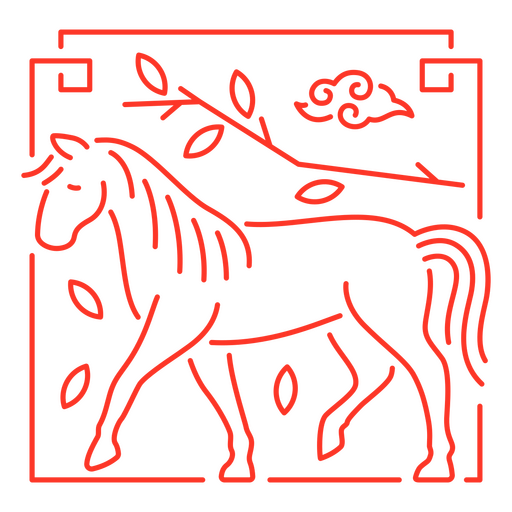
The eastern sign of horse PNG Design
Choose a folder
All favorites
Create new
Save
The eastern sign of horse PNG Design
Graph stroke icon PNG Design
Choose a folder
All favorites
Create new
Save
Graph stroke icon PNG Design
Graph bars flat PNG Design
Choose a folder
All favorites
Create new
Save
Graph bars flat PNG Design
Premium
Fortune telling card PNG Design
Choose a folder
All favorites
Create new
Save
Fortune telling card PNG Design
Bar diagram illustration PNG Design
Choose a folder
All favorites
Create new
Save
Bar diagram illustration PNG Design
Premium
The Steeple card in a skeleton-themed tarot PNG Design
Choose a folder
All favorites
Create new
Save
The Steeple card in a skeleton-themed tarot PNG Design
Premium
Tarot cards with a powerful symbol PNG Design
Choose a folder
All favorites
Create new
Save
Tarot cards with a powerful symbol PNG Design
Premium
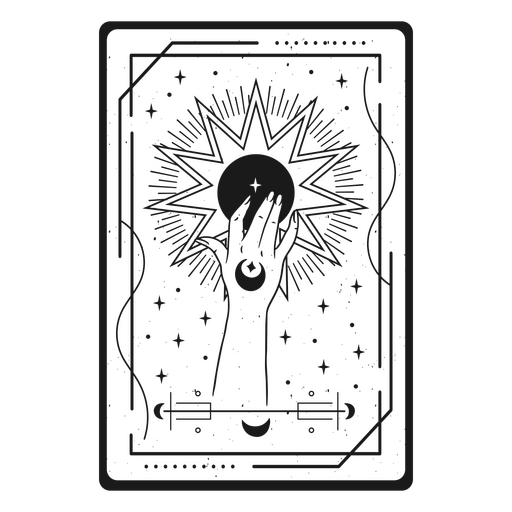
Moon design on a hand PNG Design
Choose a folder
All favorites
Create new
Save
Moon design on a hand PNG Design
Premium
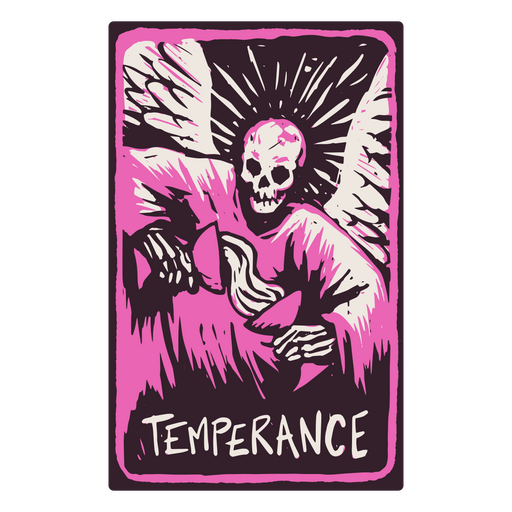
The Temperance card in a skeleton-themed tarot PNG Design
Choose a folder
All favorites
Create new
Save
The Temperance card in a skeleton-themed tarot PNG Design
Blue grey orange piechart PNG Design
Choose a folder
All favorites
Create new
Save
Blue grey orange piechart PNG Design
Graph curve stroke PNG Design
Choose a folder
All favorites
Create new
Save
Graph curve stroke PNG Design
Colorful piechart infographic PNG Design
Choose a folder
All favorites
Create new
Save
Colorful piechart infographic PNG Design
Premium
Taurus sign in the western horoscope PNG Design
Choose a folder
All favorites
Create new
Save
Taurus sign in the western horoscope PNG Design
Boost Your Business
With The Leading Graphic Platform For Merch.
SEE PLANS
Next
of 6
prev page
next page