Design Library
Explore Designs
New Merch Designs
Trending Merch Designs
Vectors
PNGs & SVGs
Mockups
T-Shirts
T-Shirt PSD Templates
KDP Designs
Phone Cases
Pillows
Tote Bags
Posters
Mugs
Design Tools
Designer
New!
T-shirt Maker
Mockup Generator
Quote Generator
Logo Maker
Resources
Merch Digest
Blog
Help Center
Creators Program
Learn About Merch
Changelog
Pricing
Loading...
Sign Up
Login
PNGs For Merch
graph
Design Library
Explore Designs
New Merch Designs
Trending Merch Designs
Vectors
PNGs & SVGs
Mockups
T-Shirts
T-Shirt PSD Templates
KDP Designs
Phone Cases
Pillows
Tote Bags
Posters
Mugs
Design Tools
Designer
New!
T-shirt Maker
Mockup Generator
Quote Generator
Logo Maker
Resources
Merch Digest
Blog
Help Center
Creators Program
Learn About Merch
Changelog
PLANS
PNGs For Merch
graph
203 graph PNG and SVG design graphic
Download graph PNG & SVG Designs with transparent background for T-Shirts, book covers, phone cases and other merch.
Related:
graphics
,
graphic
,
graphical
Sort by
Most relevant
Sponsored results by
Get 15% off with code: VEXELS15
Show more
Area graph tool PNG Design
Choose a folder
All favorites
Create new
Save
Area graph tool PNG Design
Premium
Growing graph screen stroke icon PNG Design
Choose a folder
All favorites
Create new
Save
Growing graph screen stroke icon PNG Design
Premium
Stacked bar graph tool PNG Design
Choose a folder
All favorites
Create new
Save
Stacked bar graph tool PNG Design
Clockwise movement graph flat PNG Design
Choose a folder
All favorites
Create new
Save
Clockwise movement graph flat PNG Design
Hyperbolic function graph PNG Design
Choose a folder
All favorites
Create new
Save
Hyperbolic function graph PNG Design
Logarithmic function graph stroke PNG Design
Choose a folder
All favorites
Create new
Save
Logarithmic function graph stroke PNG Design
Premium
Increasing multicolor line chart PNG Design
Choose a folder
All favorites
Create new
Save
Increasing multicolor line chart PNG Design
50 percent progress circle PNG Design
Choose a folder
All favorites
Create new
Save
50 percent progress circle PNG Design
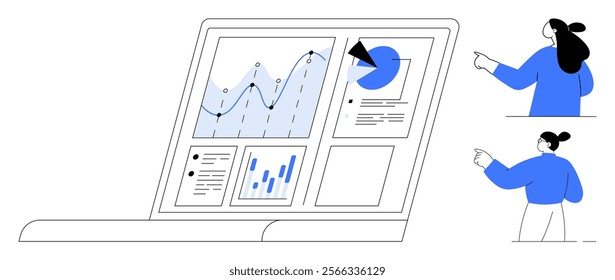
Businessman cartoon presenting board PNG Design
Choose a folder
All favorites
Create new
Save
Businessman cartoon presenting board PNG Design
Businessman showing tablet cartoon PNG Design
Choose a folder
All favorites
Create new
Save
Businessman showing tablet cartoon PNG Design
25 percent circular progress tag PNG Design
Choose a folder
All favorites
Create new
Save
25 percent circular progress tag PNG Design
Premium
Marketing chart illustration PNG Design
Choose a folder
All favorites
Create new
Save
Marketing chart illustration PNG Design
Premium
Growing colorful lines chart PNG Design
Choose a folder
All favorites
Create new
Save
Growing colorful lines chart PNG Design
75 percent progress circle PNG Design
Choose a folder
All favorites
Create new
Save
75 percent progress circle PNG Design
Premium
Infographic 50 percent doodle chart PNG Design
Choose a folder
All favorites
Create new
Save
Infographic 50 percent doodle chart PNG Design
Premium
Arrow chart PNG Design
Choose a folder
All favorites
Create new
Save
Arrow chart PNG Design
Premium
Two section pie chart PNG Design
Choose a folder
All favorites
Create new
Save
Two section pie chart PNG Design
Premium
Multistage round icons infographic PNG Design
Choose a folder
All favorites
Create new
Save
Multistage round icons infographic PNG Design
Premium
Cylinder column chart PNG Design
Choose a folder
All favorites
Create new
Save
Cylinder column chart PNG Design
Premium
Infographic 100 percent doodle PNG Design
Choose a folder
All favorites
Create new
Save
Infographic 100 percent doodle PNG Design
3d colorful pole chart PNG Design
Choose a folder
All favorites
Create new
Save
3d colorful pole chart PNG Design
Premium
Infographic 75 percent doodle chart PNG Design
Choose a folder
All favorites
Create new
Save
Infographic 75 percent doodle chart PNG Design
Premium
25 percent doodle chart PNG Design
Choose a folder
All favorites
Create new
Save
25 percent doodle chart PNG Design
Pie chart hand drawn doodle PNG Design
Choose a folder
All favorites
Create new
Save
Pie chart hand drawn doodle PNG Design
Premium
3d piechart bars PNG Design
Choose a folder
All favorites
Create new
Save
3d piechart bars PNG Design
Premium
Growing arrow dollar coin PNG Design
Choose a folder
All favorites
Create new
Save
Growing arrow dollar coin PNG Design
Premium
Businessman showing chart PNG Design
Choose a folder
All favorites
Create new
Save
Businessman showing chart PNG Design
Premium
Column chart 3d doodle PNG Design
Choose a folder
All favorites
Create new
Save
Column chart 3d doodle PNG Design
Progress round service icon PNG Design
Choose a folder
All favorites
Create new
Save
Progress round service icon PNG Design
Bar chart hand drawn element bar PNG Design
Choose a folder
All favorites
Create new
Save
Bar chart hand drawn element bar PNG Design
2d colorful bar chart infographic PNG Design
Choose a folder
All favorites
Create new
Save
2d colorful bar chart infographic PNG Design
Colorful four parts pie chart PNG Design
Choose a folder
All favorites
Create new
Save
Colorful four parts pie chart PNG Design
Premium
Pilling up cubes chart PNG Design
Choose a folder
All favorites
Create new
Save
Pilling up cubes chart PNG Design
Premium
Business presentation board PNG Design
Choose a folder
All favorites
Create new
Save
Business presentation board PNG Design
Premium
Flat colorful pie chart PNG Design
Choose a folder
All favorites
Create new
Save
Flat colorful pie chart PNG Design
Colorful piechart PNG Design
Choose a folder
All favorites
Create new
Save
Colorful piechart PNG Design
Premium
Two section column chart PNG Design
Choose a folder
All favorites
Create new
Save
Two section column chart PNG Design
Premium
Glossy colorful piechart with boxes PNG Design
Choose a folder
All favorites
Create new
Save
Glossy colorful piechart with boxes PNG Design
Premium
Half grey 3 parts piechart PNG Design
Choose a folder
All favorites
Create new
Save
Half grey 3 parts piechart PNG Design
Arrow direction covered van PNG Design
Choose a folder
All favorites
Create new
Save
Arrow direction covered van PNG Design
Premium
Pie chart arrow PNG Design
Choose a folder
All favorites
Create new
Save
Pie chart arrow PNG Design
Premium
Pie chart with arrows PNG Design
Choose a folder
All favorites
Create new
Save
Pie chart with arrows PNG Design
Delivery transport diagram silhouette PNG Design
Choose a folder
All favorites
Create new
Save
Delivery transport diagram silhouette PNG Design
Premium
Flat piechart infographic PNG Design
Choose a folder
All favorites
Create new
Save
Flat piechart infographic PNG Design
4 part christmas pie chart PNG Design
Choose a folder
All favorites
Create new
Save
4 part christmas pie chart PNG Design
Real estate chart infographic PNG Design
Choose a folder
All favorites
Create new
Save
Real estate chart infographic PNG Design
Premium
Colorful bars chart 6 PNG Design
Choose a folder
All favorites
Create new
Save
Colorful bars chart 6 PNG Design
Gaussian bell flat PNG Design
Choose a folder
All favorites
Create new
Save
Gaussian bell flat PNG Design
Premium
Colorful arrow pie chart PNG Design
Choose a folder
All favorites
Create new
Save
Colorful arrow pie chart PNG Design
Premium
Blue pie chart 1 PNG Design
Choose a folder
All favorites
Create new
Save
Blue pie chart 1 PNG Design
Boost Your Business
With The Leading Graphic Platform For Merch.
SEE PLANS
Next
of 5
prev page
next page