Design Library
Explore Designs
New Merch Designs
Trending Merch Designs
Vectors
PNGs & SVGs
Mockups
T-Shirts
T-Shirt PSD Templates
KDP Designs
Phone Cases
Pillows
Tote Bags
Posters
Mugs
Design Tools
Designer
New!
T-shirt Maker
Mockup Generator
Quote Generator
Logo Maker
Resources
Merch Digest
Blog
Help Center
Creators Program
Learn About Merch
Changelog
Pricing
Loading...
Sign Up
Login
PNGs For Merch
graph
Design Library
Explore Designs
New Merch Designs
Trending Merch Designs
Vectors
PNGs & SVGs
Mockups
T-Shirts
T-Shirt PSD Templates
KDP Designs
Phone Cases
Pillows
Tote Bags
Posters
Mugs
Design Tools
Designer
New!
T-shirt Maker
Mockup Generator
Quote Generator
Logo Maker
Resources
Merch Digest
Blog
Help Center
Creators Program
Learn About Merch
Changelog
PLANS
PNGs For Merch
graph
203 graph PNG and SVG design graphic
Download graph PNG & SVG Designs with transparent background for T-Shirts, book covers, phone cases and other merch.
Related:
graphics
,
graphic
,
graphical
Sort by
Most relevant
Sponsored results by
Get 15% off with code: VEXELS15
Show more
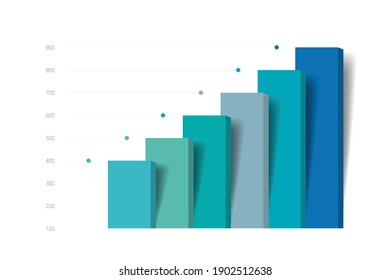
Large 3d bar chart hand drawing PNG Design
Choose a folder
All favorites
Create new
Save
Large 3d bar chart hand drawing PNG Design
3d bar chart hand drawn PNG Design
Choose a folder
All favorites
Create new
Save
3d bar chart hand drawn PNG Design
Angle school doodle PNG Design
Choose a folder
All favorites
Create new
Save
Angle school doodle PNG Design
Boost Your Business
With The Leading Graphic Platform For Merch.
SEE PLANS
of 5
prev page
next page