Design Library
Explore Designs
New Merch Designs
Trending Merch Designs
Vectors
PNGs & SVGs
Mockups
T-Shirts
T-Shirt PSD Templates
KDP Designs
Phone Cases
Pillows
Tote Bags
Posters
Mugs
Design Tools
Designer
New!
T-shirt Maker
Mockup Generator
Quote Generator
Logo Maker
Resources
Merch Digest
Blog
Help Center
Creators Program
Learn About Merch
Changelog
Pricing
Loading...
Sign Up
Login
Merch Vectors
business
chart
Design Library
Explore Designs
New Merch Designs
Trending Merch Designs
Vectors
PNGs & SVGs
Mockups
T-Shirts
T-Shirt PSD Templates
KDP Designs
Phone Cases
Pillows
Tote Bags
Posters
Mugs
Design Tools
Designer
New!
T-shirt Maker
Mockup Generator
Quote Generator
Logo Maker
Resources
Merch Digest
Blog
Help Center
Creators Program
Learn About Merch
Changelog
PLANS
Merch Vectors
business
chart
117 business chart Vector Designs for T-Shirts and merch
Download & buy editable business chart AI Vector Graphics Designs for T shirts, Phone Cases, Book Covers and other Merch
Sort by
Most relevant
Sponsored results by
Get 15% off with code: VEXELS15
Show more
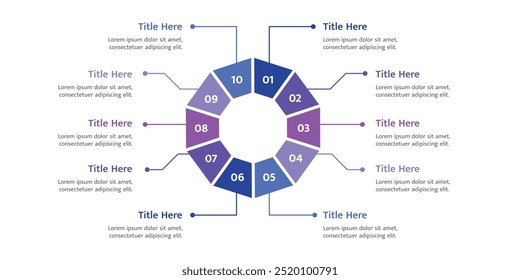
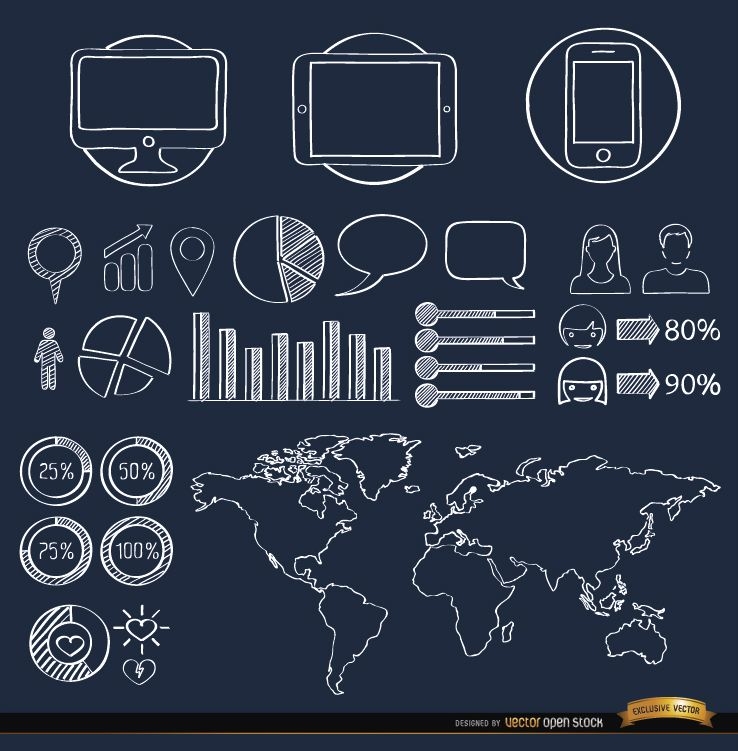
Hand drawn infographic elements
Choose a folder
All favorites
Create new
Save
Hand drawn infographic elements
Shiny Arrow Circle
Choose a folder
All favorites
Create new
Save
Shiny Arrow Circle
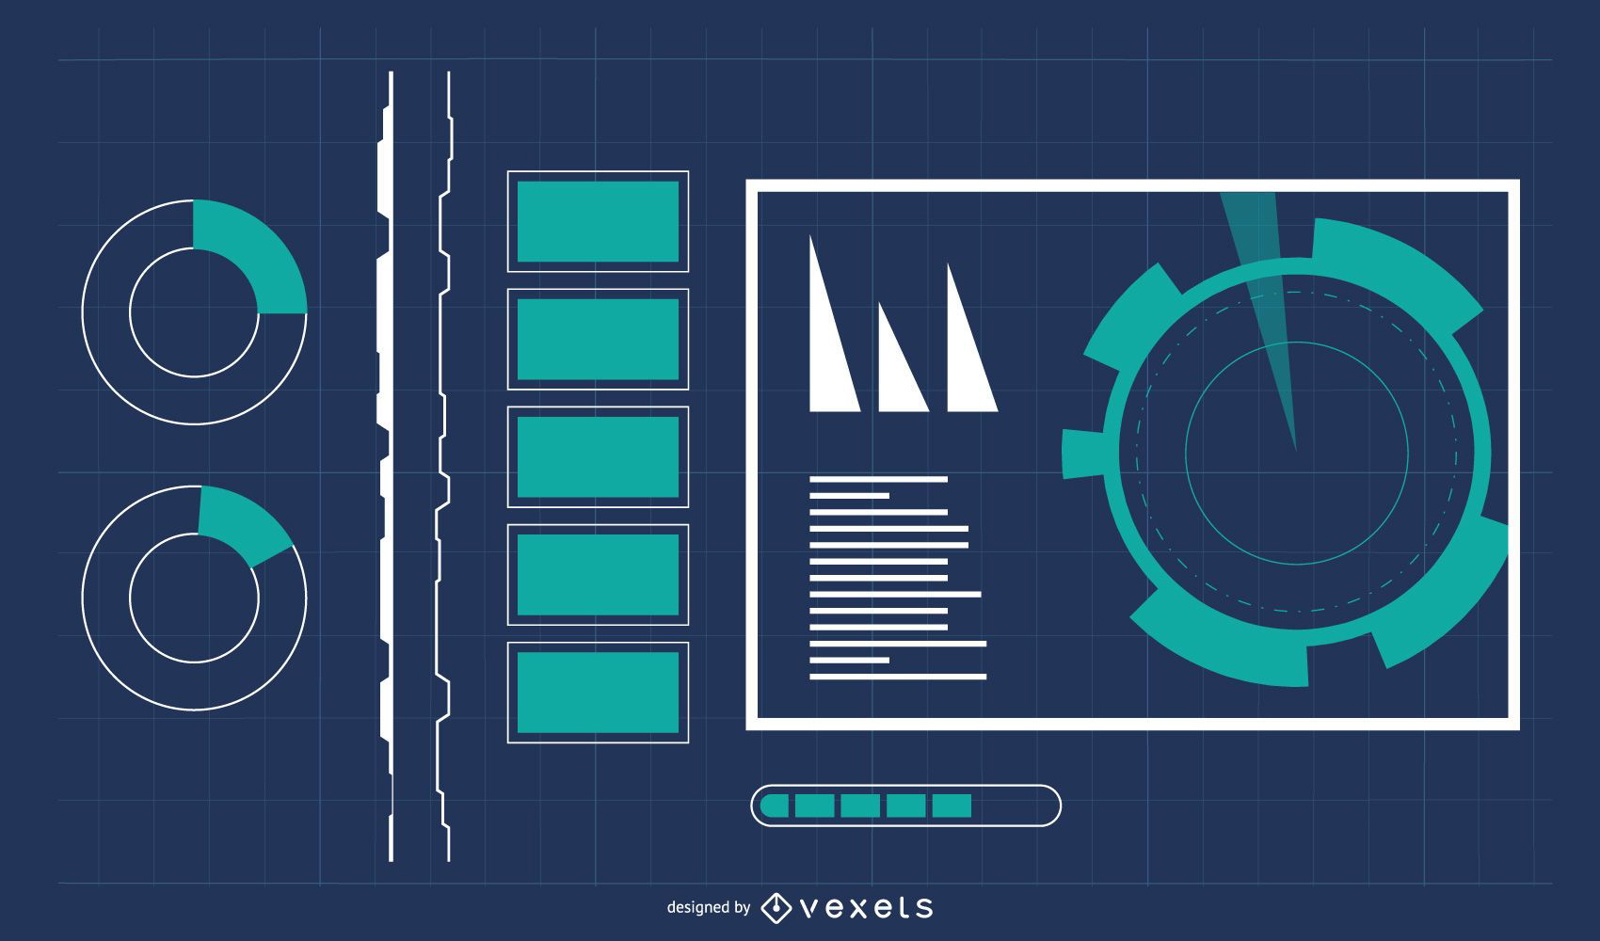
Digital Technology Background with Info-Graphic
Choose a folder
All favorites
Create new
Save
Digital Technology Background with Info-Graphic
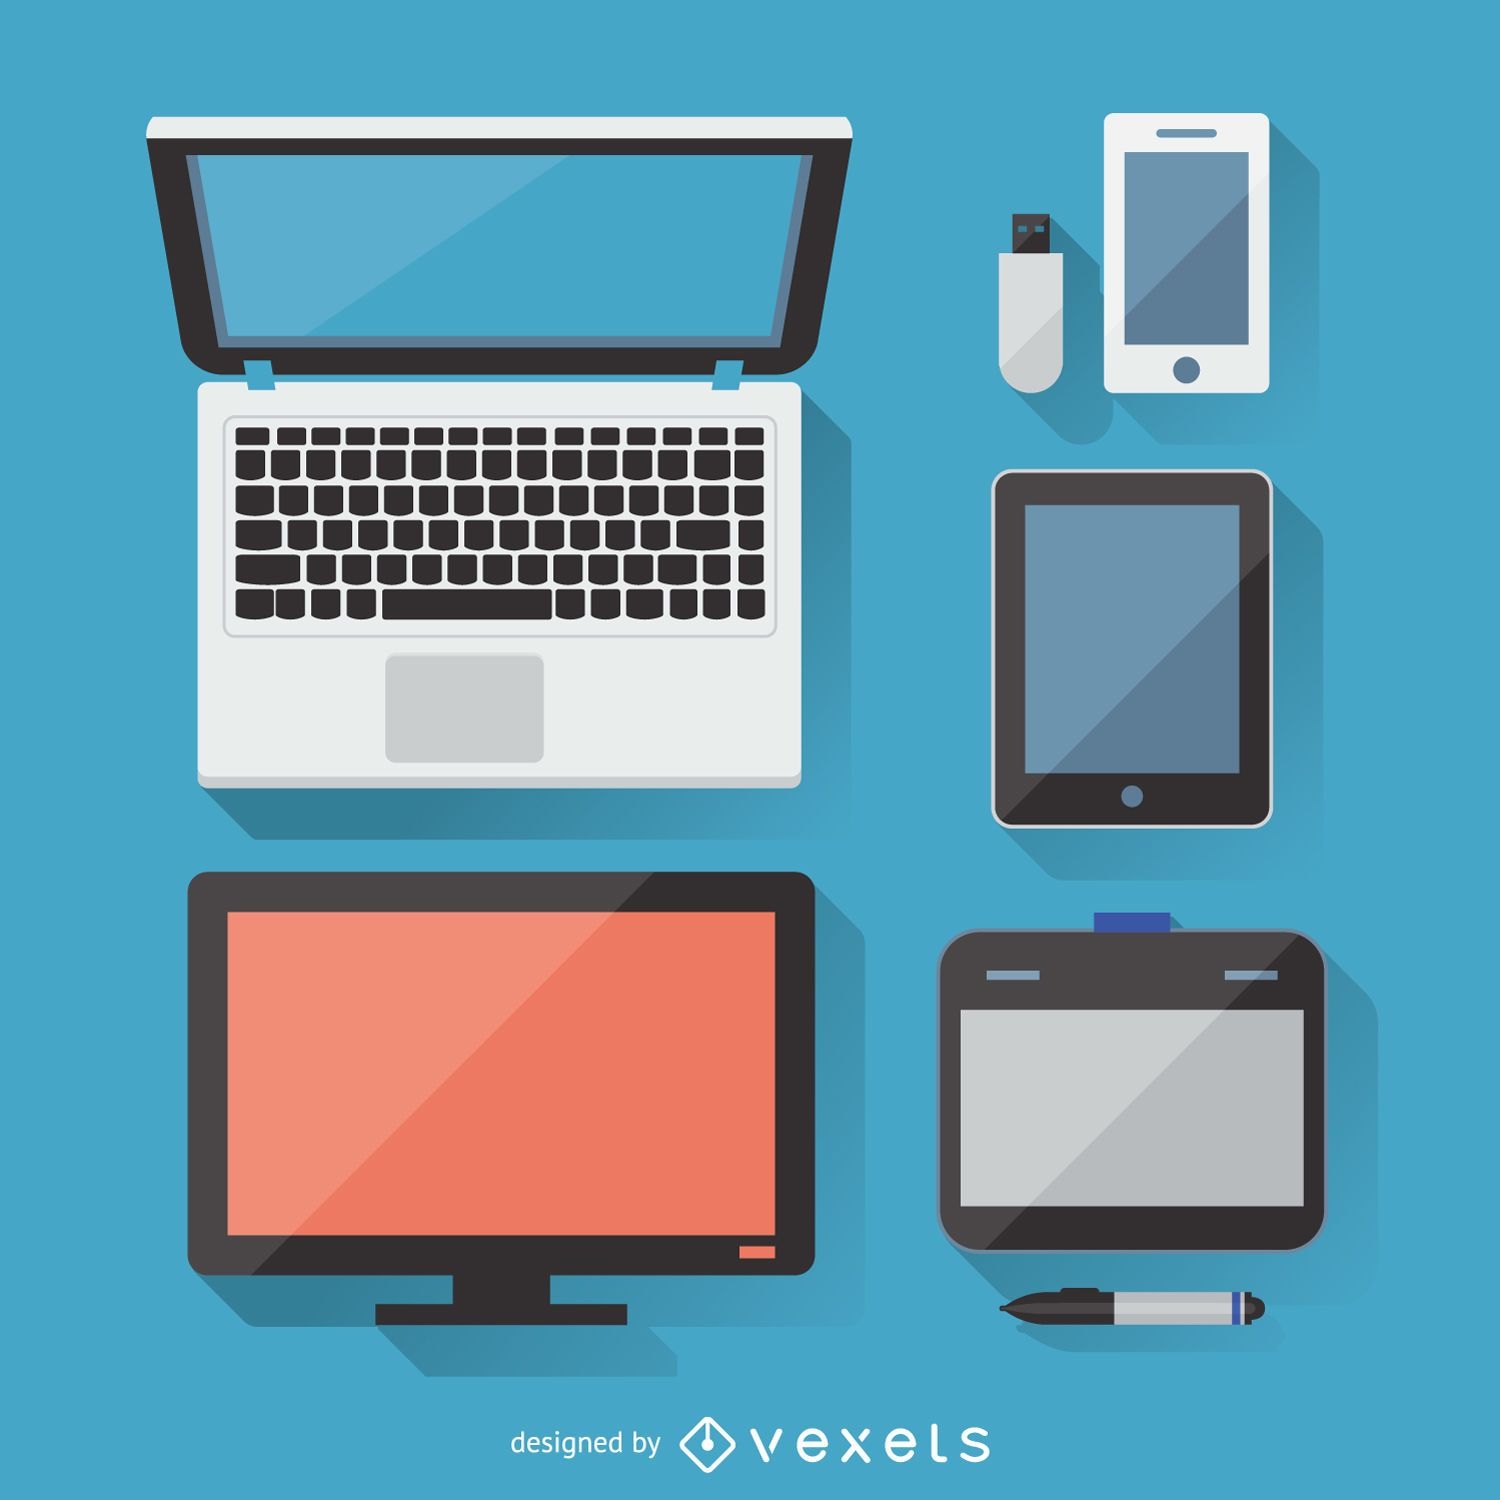
Flat electronic devices with shadows set
Choose a folder
All favorites
Create new
Save
Flat electronic devices with shadows set
Premium
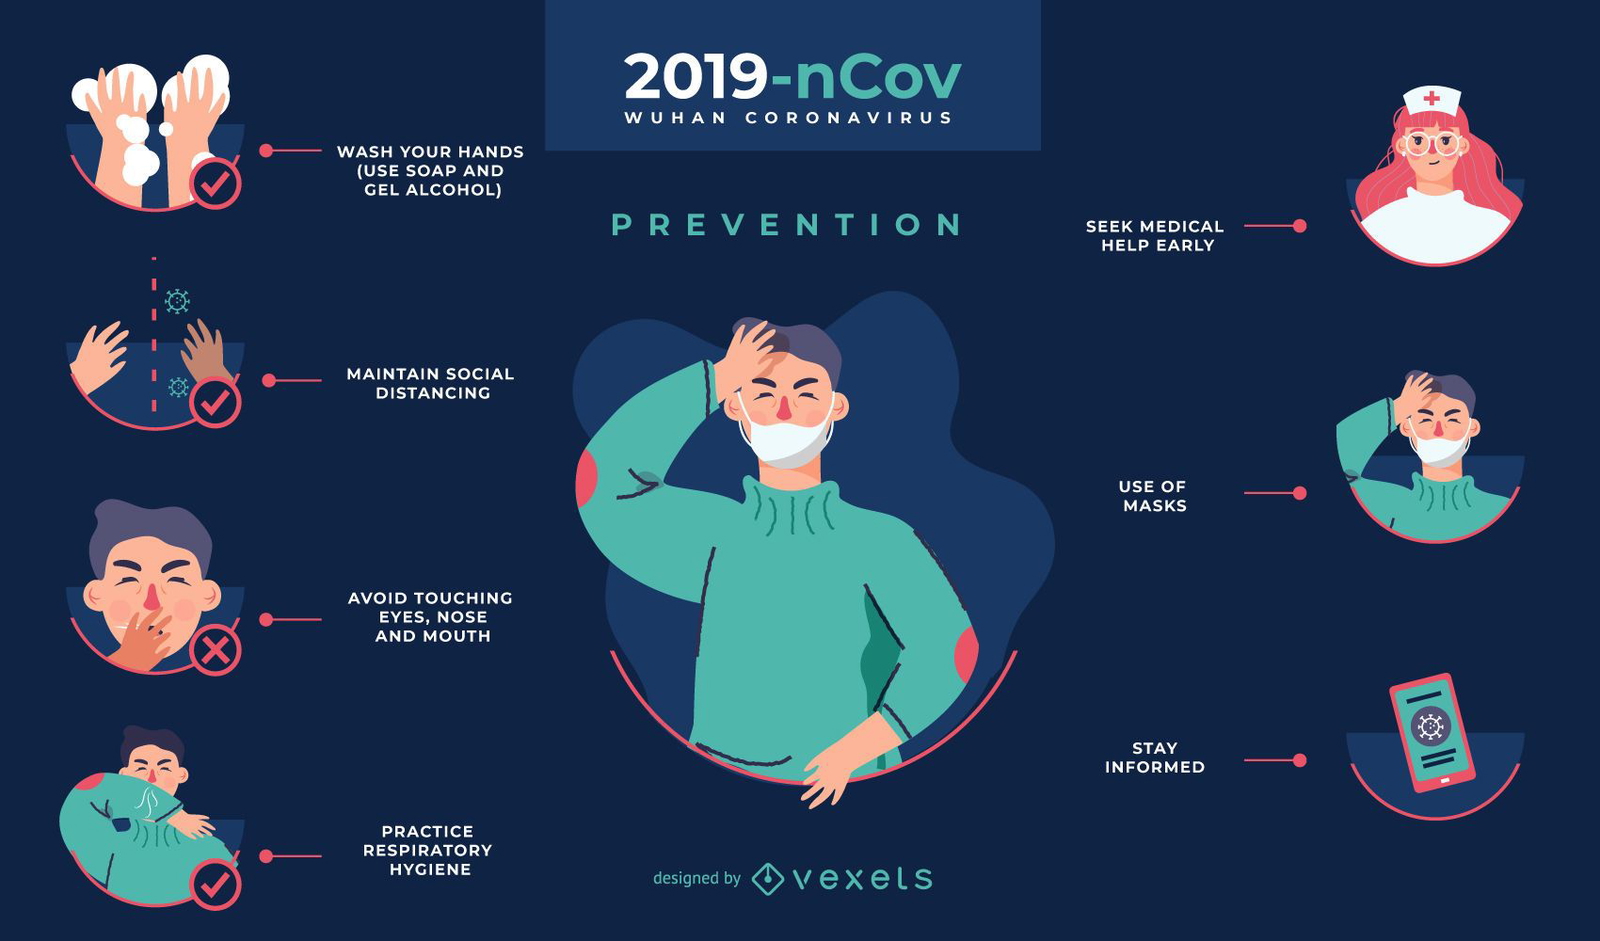
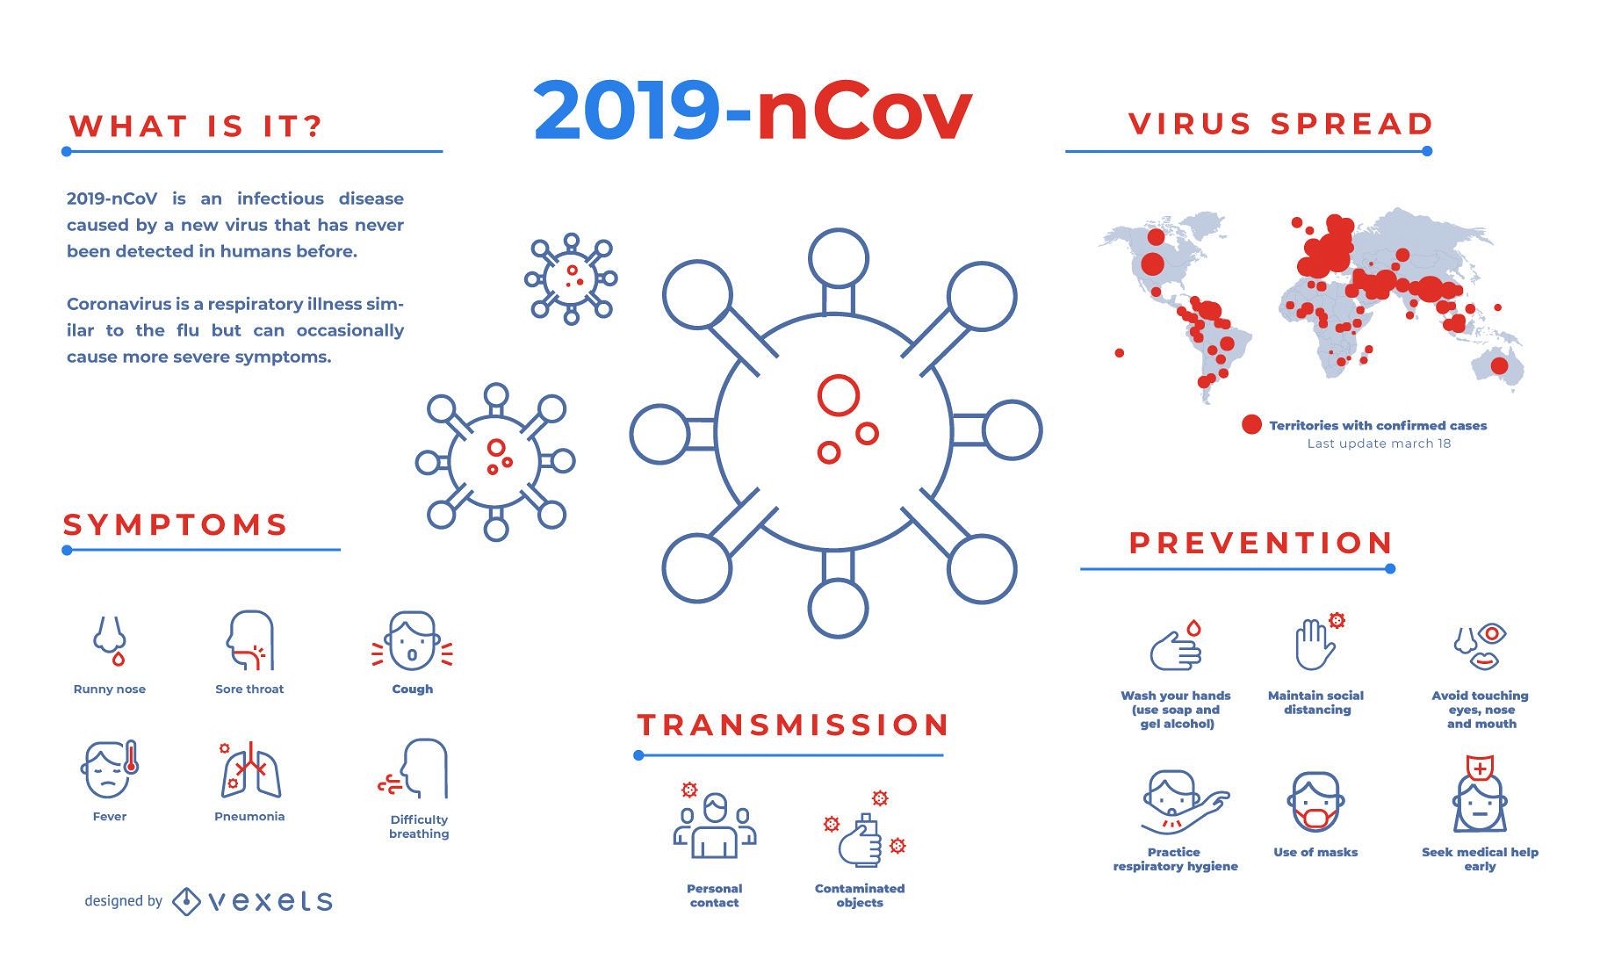
Covid-19 prevention infographic template
Choose a folder
All favorites
Create new
Save
Covid-19 prevention infographic template
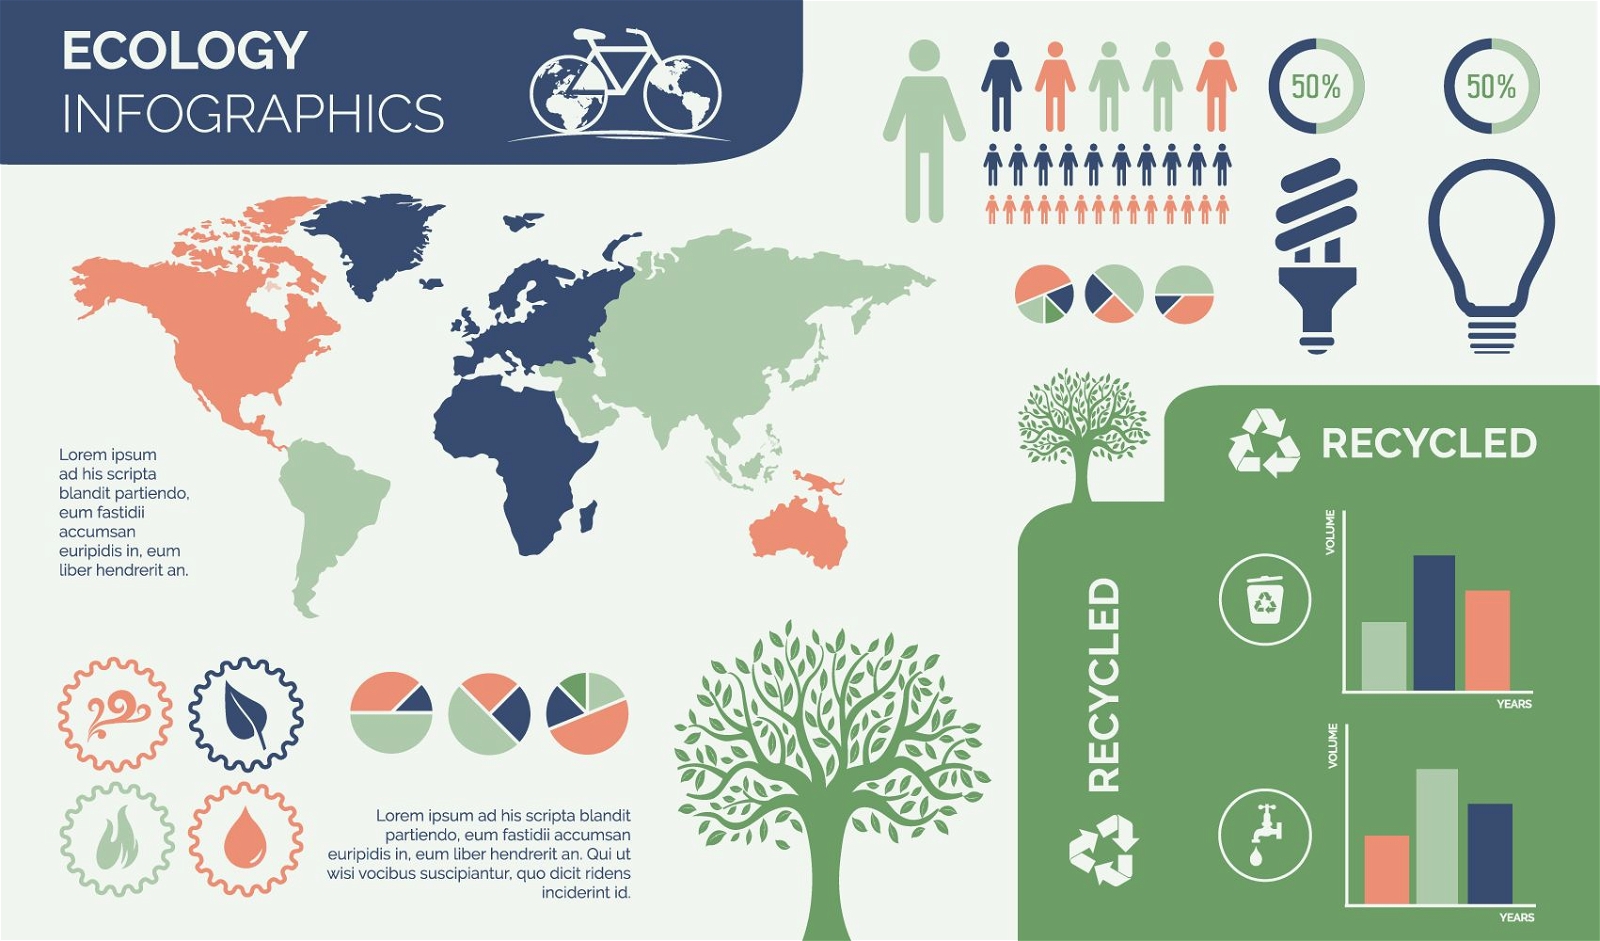
Environmental Ecology Infographic Design
Choose a folder
All favorites
Create new
Save
Environmental Ecology Infographic Design
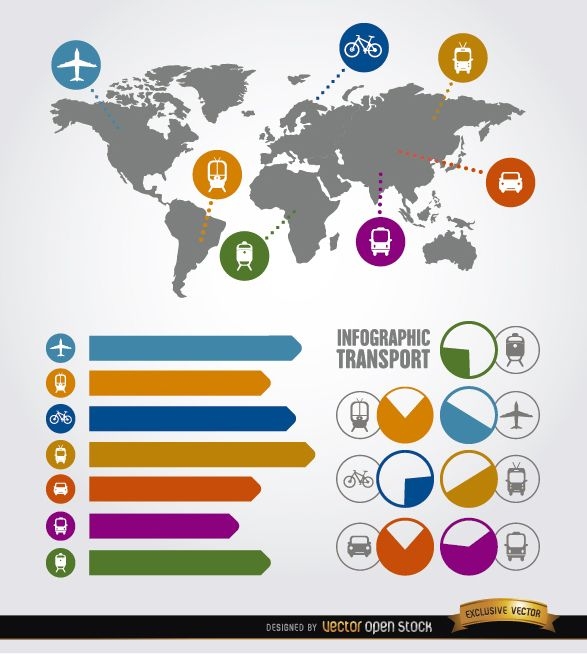
Travel infographic transport elements
Choose a folder
All favorites
Create new
Save
Travel infographic transport elements
Premium
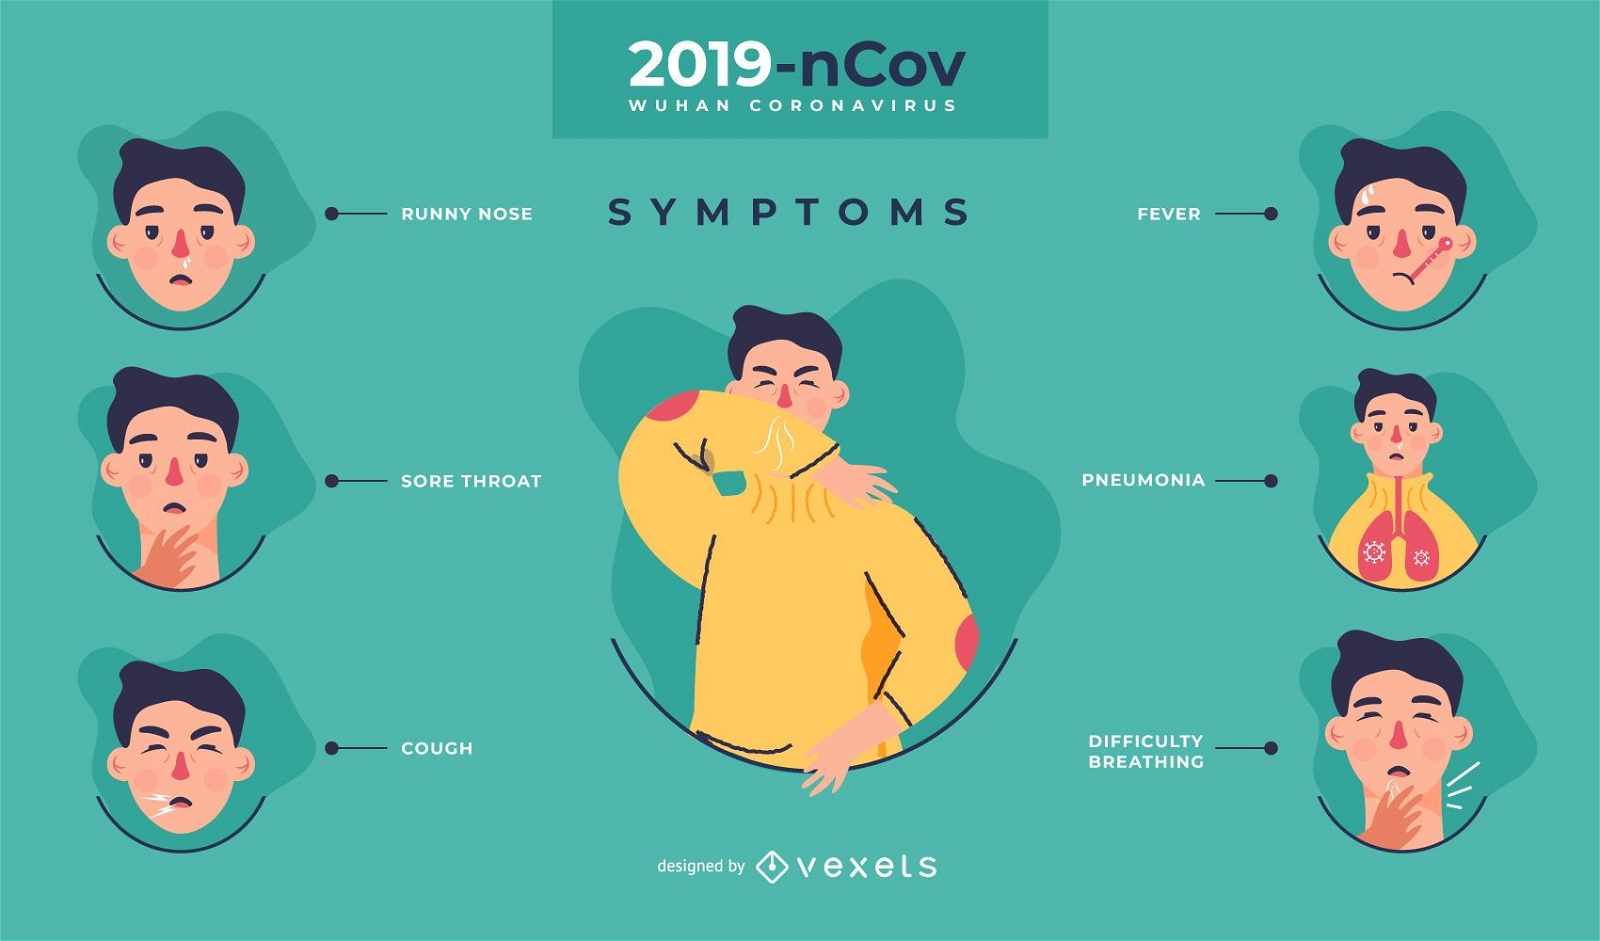
Covid-19 symptoms infographic template
Choose a folder
All favorites
Create new
Save
Covid-19 symptoms infographic template
Timeline infographic template set
Choose a folder
All favorites
Create new
Save
Timeline infographic template set
Christmas Infographic elements
Choose a folder
All favorites
Create new
Save
Christmas Infographic elements
No GMO label set
Choose a folder
All favorites
Create new
Save
No GMO label set
Colorful Glowing Background
Choose a folder
All favorites
Create new
Save
Colorful Glowing Background
Icon set
Choose a folder
All favorites
Create new
Save
Icon set
Premium
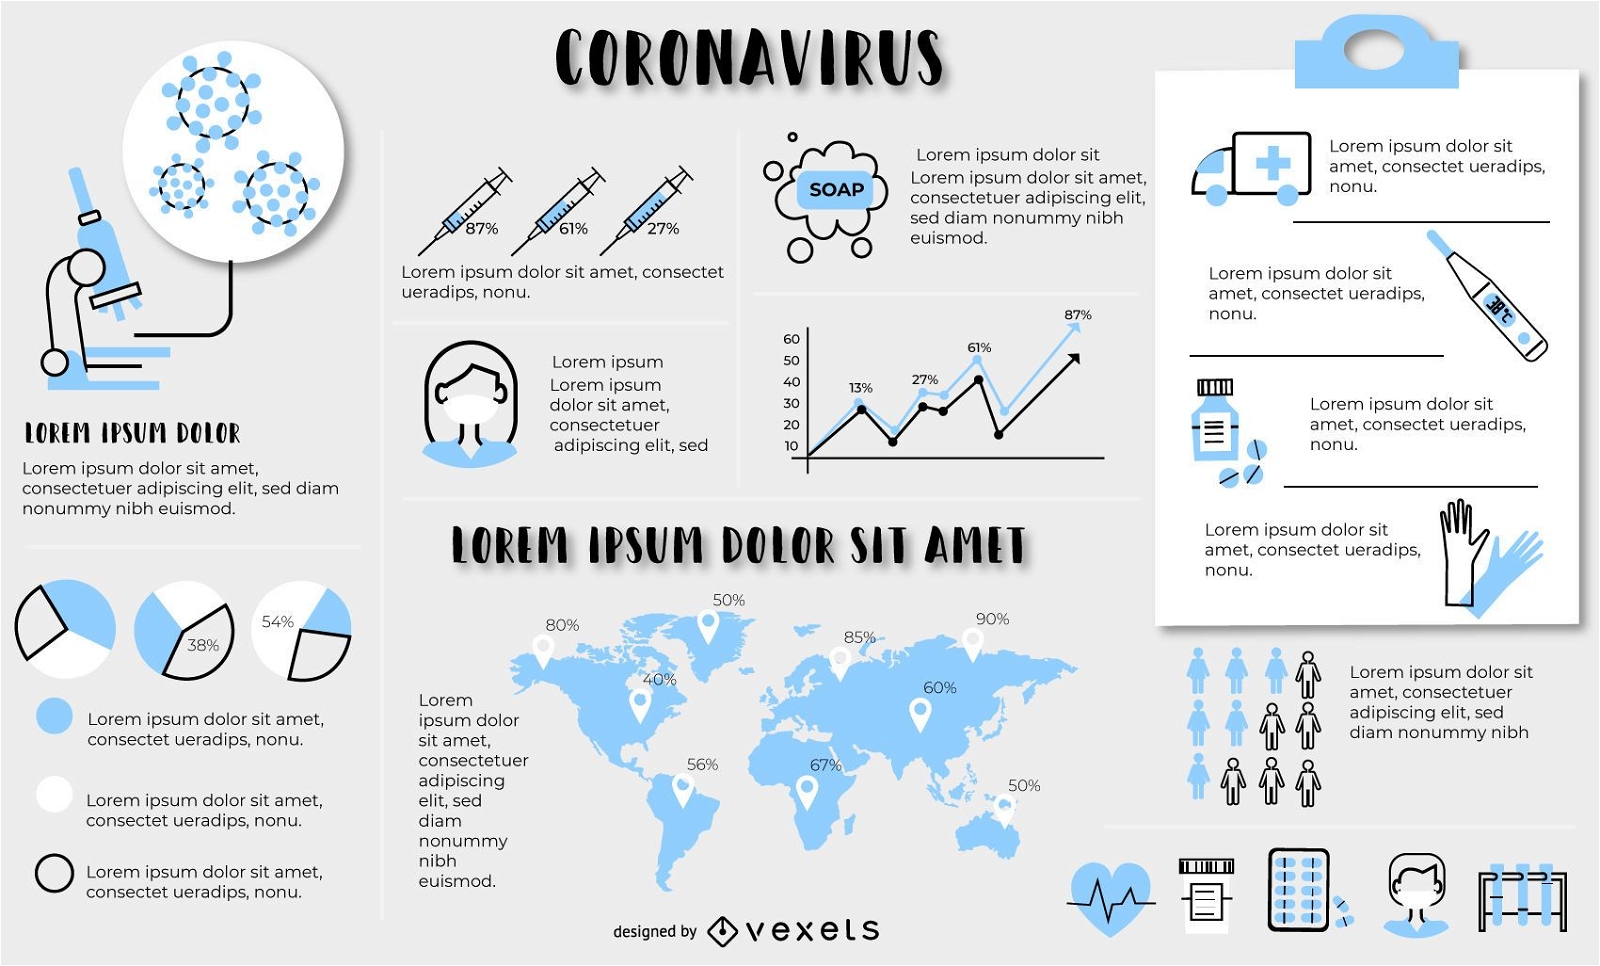
Covid-19 infographic template
Choose a folder
All favorites
Create new
Save
Covid-19 infographic template
Editable text
Premium
Coronavirus infographic elements template
Choose a folder
All favorites
Create new
Save
Coronavirus infographic elements template
Web 2.0 vector icons
Choose a folder
All favorites
Create new
Save
Web 2.0 vector icons
2d orange web 2.0 icons
Choose a folder
All favorites
Create new
Save
2d orange web 2.0 icons
Boost Your Business
With The Leading Graphic Platform For Merch.
SEE PLANS
of 3
prev page
next page