Design Library
Explore Designs
New Merch Designs
Trending Merch Designs
Vectors
PNGs & SVGs
Mockups
T-Shirts
T-Shirt PSD Templates
KDP Designs
Phone Cases
Pillows
Tote Bags
Posters
Mugs
Design Tools
Designer
New!
T-shirt Maker
Mockup Generator
Quote Generator
Logo Maker
Resources
Merch Digest
Blog
Help Center
Creators Program
Learn About Merch
Changelog
Pricing
Loading...
Sign Up
Login
PNG
graph
Design Library
Explore Designs
New Merch Designs
Trending Merch Designs
Vectors
PNGs & SVGs
Mockups
T-Shirts
T-Shirt PSD Templates
KDP Designs
Phone Cases
Pillows
Tote Bags
Posters
Mugs
Design Tools
Designer
New!
T-shirt Maker
Mockup Generator
Quote Generator
Logo Maker
Resources
Merch Digest
Blog
Help Center
Creators Program
Learn About Merch
Changelog
PLANS
PNG
graph
203 graph PNG and SVG Editable Vectors
Download editable graph PNG and SVG Vectors with transparent background.
Related:
graphics
,
graphic
,
graphical
Sort by
Most relevant
Sponsored results by
Get 15% off with code: VEXELS15
Show more
Premium
Graph circle line stroke PNG Design
Choose a folder
All favorites
Create new
Save
Graph circle line stroke PNG Design
Premium
Graph tv circle icon PNG Design
Choose a folder
All favorites
Create new
Save
Graph tv circle icon PNG Design
Premium
Two sided colorful bar graph PNG Design
Choose a folder
All favorites
Create new
Save
Two sided colorful bar graph PNG Design
Premium
Line graph PNG Design
Choose a folder
All favorites
Create new
Save
Line graph PNG Design
Premium
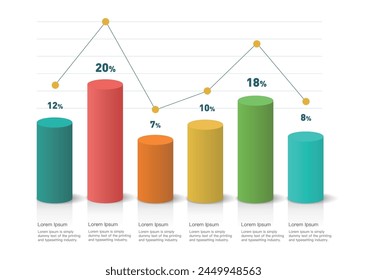
Multicolor bar graph with icons PNG Design
Choose a folder
All favorites
Create new
Save
Multicolor bar graph with icons PNG Design
Colorful bar graph icon PNG Design
Choose a folder
All favorites
Create new
Save
Colorful bar graph icon PNG Design
Premium
Graph square infographic sticker PNG Design
Choose a folder
All favorites
Create new
Save
Graph square infographic sticker PNG Design
Growing graph bars stroke PNG Design
Choose a folder
All favorites
Create new
Save
Growing graph bars stroke PNG Design
Premium
Bar graph square icon PNG Design
Choose a folder
All favorites
Create new
Save
Bar graph square icon PNG Design
Graph presentation doodle PNG Design
Choose a folder
All favorites
Create new
Save
Graph presentation doodle PNG Design
Lineal function graph doodle PNG Design
Choose a folder
All favorites
Create new
Save
Lineal function graph doodle PNG Design
Premium
Smartphone with graph icon PNG Design
Choose a folder
All favorites
Create new
Save
Smartphone with graph icon PNG Design
Logarithmic function graph flat PNG Design
Choose a folder
All favorites
Create new
Save
Logarithmic function graph flat PNG Design
Premium
Growing graph sign PNG Design
Choose a folder
All favorites
Create new
Save
Growing graph sign PNG Design
Premium
Graph in mobile display PNG Design
Choose a folder
All favorites
Create new
Save
Graph in mobile display PNG Design
Premium
Radar graph tool PNG Design
Choose a folder
All favorites
Create new
Save
Radar graph tool PNG Design
Premium
Isometric graph board icon PNG Design
Choose a folder
All favorites
Create new
Save
Isometric graph board icon PNG Design
Premium
Graph on smartphone icon PNG Design
Choose a folder
All favorites
Create new
Save
Graph on smartphone icon PNG Design
Lineal function graph PNG Design
Choose a folder
All favorites
Create new
Save
Lineal function graph PNG Design
Premium
Graph bubble icon PNG Design
Choose a folder
All favorites
Create new
Save
Graph bubble icon PNG Design
Premium
Growing graph on smartphone icon PNG Design
Choose a folder
All favorites
Create new
Save
Growing graph on smartphone icon PNG Design
Quadratic function graph doodle PNG Design
Choose a folder
All favorites
Create new
Save
Quadratic function graph doodle PNG Design
Premium
Line graph tool PNG Design
Choose a folder
All favorites
Create new
Save
Line graph tool PNG Design
Lineal function graph stroke PNG Design
Choose a folder
All favorites
Create new
Save
Lineal function graph stroke PNG Design
Graph stroke icon PNG Design
Choose a folder
All favorites
Create new
Save
Graph stroke icon PNG Design
Graph bars flat PNG Design
Choose a folder
All favorites
Create new
Save
Graph bars flat PNG Design
Quadratic function graph flat PNG Design
Choose a folder
All favorites
Create new
Save
Quadratic function graph flat PNG Design
Lineal function graph flat PNG Design
Choose a folder
All favorites
Create new
Save
Lineal function graph flat PNG Design
Graph curve stroke PNG Design
Choose a folder
All favorites
Create new
Save
Graph curve stroke PNG Design
Premium
Round strip doodle graph PNG Design
Choose a folder
All favorites
Create new
Save
Round strip doodle graph PNG Design
Premium
Pie graph tool PNG Design
Choose a folder
All favorites
Create new
Save
Pie graph tool PNG Design
Premium
Scatter graph tool PNG Design
Choose a folder
All favorites
Create new
Save
Scatter graph tool PNG Design
Premium
Stacked column graph tool PNG Design
Choose a folder
All favorites
Create new
Save
Stacked column graph tool PNG Design
Bar graph tool PNG Design
Choose a folder
All favorites
Create new
Save
Bar graph tool PNG Design
Cumulative triangle graph illustration PNG Design
Choose a folder
All favorites
Create new
Save
Cumulative triangle graph illustration PNG Design
Hyperbolic function graph flat PNG Design
Choose a folder
All favorites
Create new
Save
Hyperbolic function graph flat PNG Design
Logarithmic function graph doodle PNG Design
Choose a folder
All favorites
Create new
Save
Logarithmic function graph doodle PNG Design
Premium
Growing graph stroke icon PNG Design
Choose a folder
All favorites
Create new
Save
Growing graph stroke icon PNG Design
Hyperbolic function graph stroke PNG Design
Choose a folder
All favorites
Create new
Save
Hyperbolic function graph stroke PNG Design
Column graph tool PNG Design
Choose a folder
All favorites
Create new
Save
Column graph tool PNG Design
Bar graph inside computer window icon bar graph PNG Design
Choose a folder
All favorites
Create new
Save
Bar graph inside computer window icon bar graph PNG Design
Graph curve flat PNG Design
Choose a folder
All favorites
Create new
Save
Graph curve flat PNG Design
Growing graph icon stroke pink PNG Design
Choose a folder
All favorites
Create new
Save
Growing graph icon stroke pink PNG Design
Premium
Graph square icon PNG Design
Choose a folder
All favorites
Create new
Save
Graph square icon PNG Design
Growing graph icon PNG Design
Choose a folder
All favorites
Create new
Save
Growing graph icon PNG Design
Bar graph inside computer window icon PNG Design
Choose a folder
All favorites
Create new
Save
Bar graph inside computer window icon PNG Design
Graph flat icon PNG Design
Choose a folder
All favorites
Create new
Save
Graph flat icon PNG Design
Clockwise movement graph stroke PNG Design
Choose a folder
All favorites
Create new
Save
Clockwise movement graph stroke PNG Design
Graph curve doodle PNG Design
Choose a folder
All favorites
Create new
Save
Graph curve doodle PNG Design
Area graph tool PNG Design
Choose a folder
All favorites
Create new
Save
Area graph tool PNG Design
Subscribe
To Get High-Quality Commercial Use Designs For Your Business
SEE PLANS
Next
of 5
prev page
next page