Design Library
Explore Designs
New Merch Designs
Trending Merch Designs
Vectors
PNGs & SVGs
Mockups
T-Shirts
T-Shirt PSD Templates
KDP Designs
Phone Cases
Pillows
Tote Bags
Posters
Mugs
Design Tools
Designer
New!
T-shirt Maker
Mockup Generator
Quote Generator
Logo Maker
Resources
Merch Digest
Blog
Help Center
Creators Program
Learn About Merch
Changelog
Pricing
Loading...
Sign Up
Login
PNG
graph
Design Library
Explore Designs
New Merch Designs
Trending Merch Designs
Vectors
PNGs & SVGs
Mockups
T-Shirts
T-Shirt PSD Templates
KDP Designs
Phone Cases
Pillows
Tote Bags
Posters
Mugs
Design Tools
Designer
New!
T-shirt Maker
Mockup Generator
Quote Generator
Logo Maker
Resources
Merch Digest
Blog
Help Center
Creators Program
Learn About Merch
Changelog
PLANS
PNG
graph
363 graph PNG and SVG Editable Vectors
Download editable graph PNG and SVG Vectors with transparent background.
Related:
graphics
,
graphic
,
graphical
Sort by
Most relevant
Sponsored results by
Get 15% off with code: VEXELS15
Show more
×
We didn't find any
graph
PNG, but here's all our
graph
designs or
request design here
Premium
Blue pie chart PNG Design
Choose a folder
All favorites
Create new
Save
Blue pie chart PNG Design
Blue grey orange pie chart PNG Design
Choose a folder
All favorites
Create new
Save
Blue grey orange pie chart PNG Design
Editable Template
Premium
Infographic abstract template
Choose a folder
All favorites
Create new
Save
Infographic abstract template
Money chart stroke icon PNG Design
Choose a folder
All favorites
Create new
Save
Money chart stroke icon PNG Design
Editable text
Premium
Data research landing page template
Choose a folder
All favorites
Create new
Save
Data research landing page template
Premium
Chart columns 3d doodle PNG Design
Choose a folder
All favorites
Create new
Save
Chart columns 3d doodle PNG Design
4 parts piechart infographic PNG Design
Choose a folder
All favorites
Create new
Save
4 parts piechart infographic PNG Design
Premium
Multicolor rounded edge bar chart PNG Design
Choose a folder
All favorites
Create new
Save
Multicolor rounded edge bar chart PNG Design
Editable text
Premium
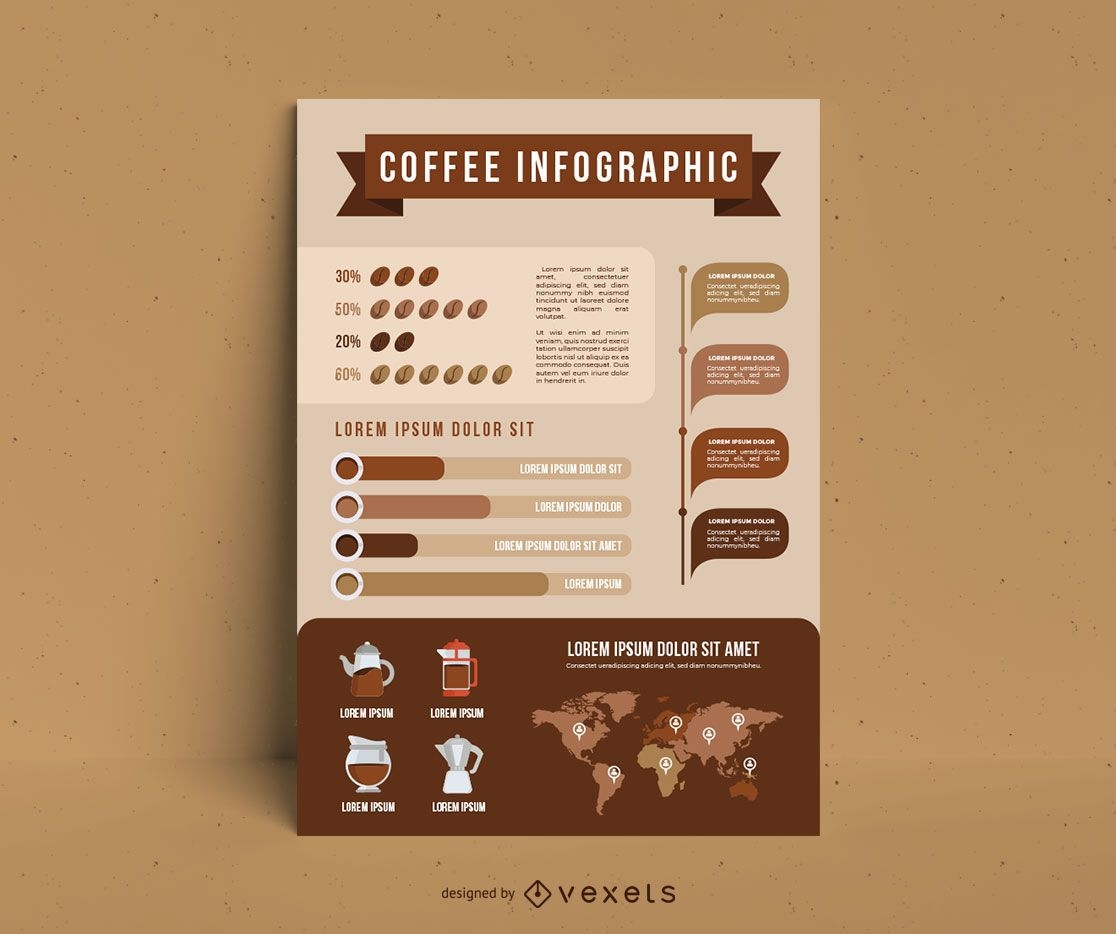
Coffee infographic
Choose a folder
All favorites
Create new
Save
Coffee infographic
Chart on smartphone icon PNG Design
Choose a folder
All favorites
Create new
Save
Chart on smartphone icon PNG Design
Bauble christmas pie chart PNG Design
Choose a folder
All favorites
Create new
Save
Bauble christmas pie chart PNG Design
Premium
Three parts pie chart PNG Design
Choose a folder
All favorites
Create new
Save
Three parts pie chart PNG Design
Premium
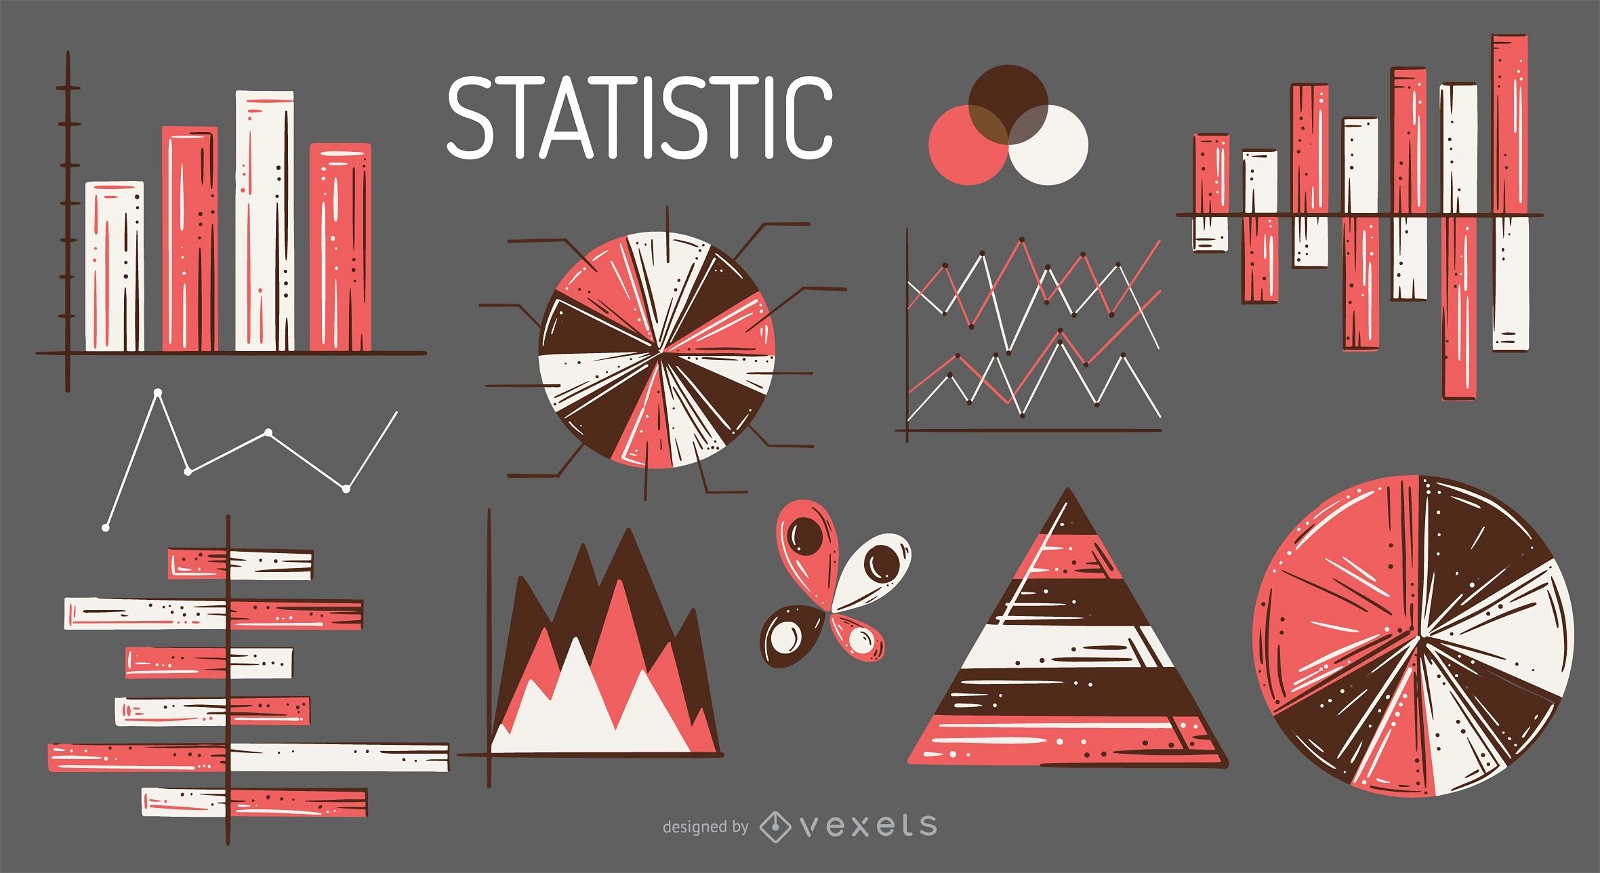
Statistic elements illustration set
Choose a folder
All favorites
Create new
Save
Statistic elements illustration set
Premium
Colorful bars infograph 8 PNG Design
Choose a folder
All favorites
Create new
Save
Colorful bars infograph 8 PNG Design
Premium
Flat pie chart icon PNG Design
Choose a folder
All favorites
Create new
Save
Flat pie chart icon PNG Design
Blue green brown vertical bars PNG Design
Choose a folder
All favorites
Create new
Save
Blue green brown vertical bars PNG Design
Premium
Pie chart icon PNG Design
Choose a folder
All favorites
Create new
Save
Pie chart icon PNG Design
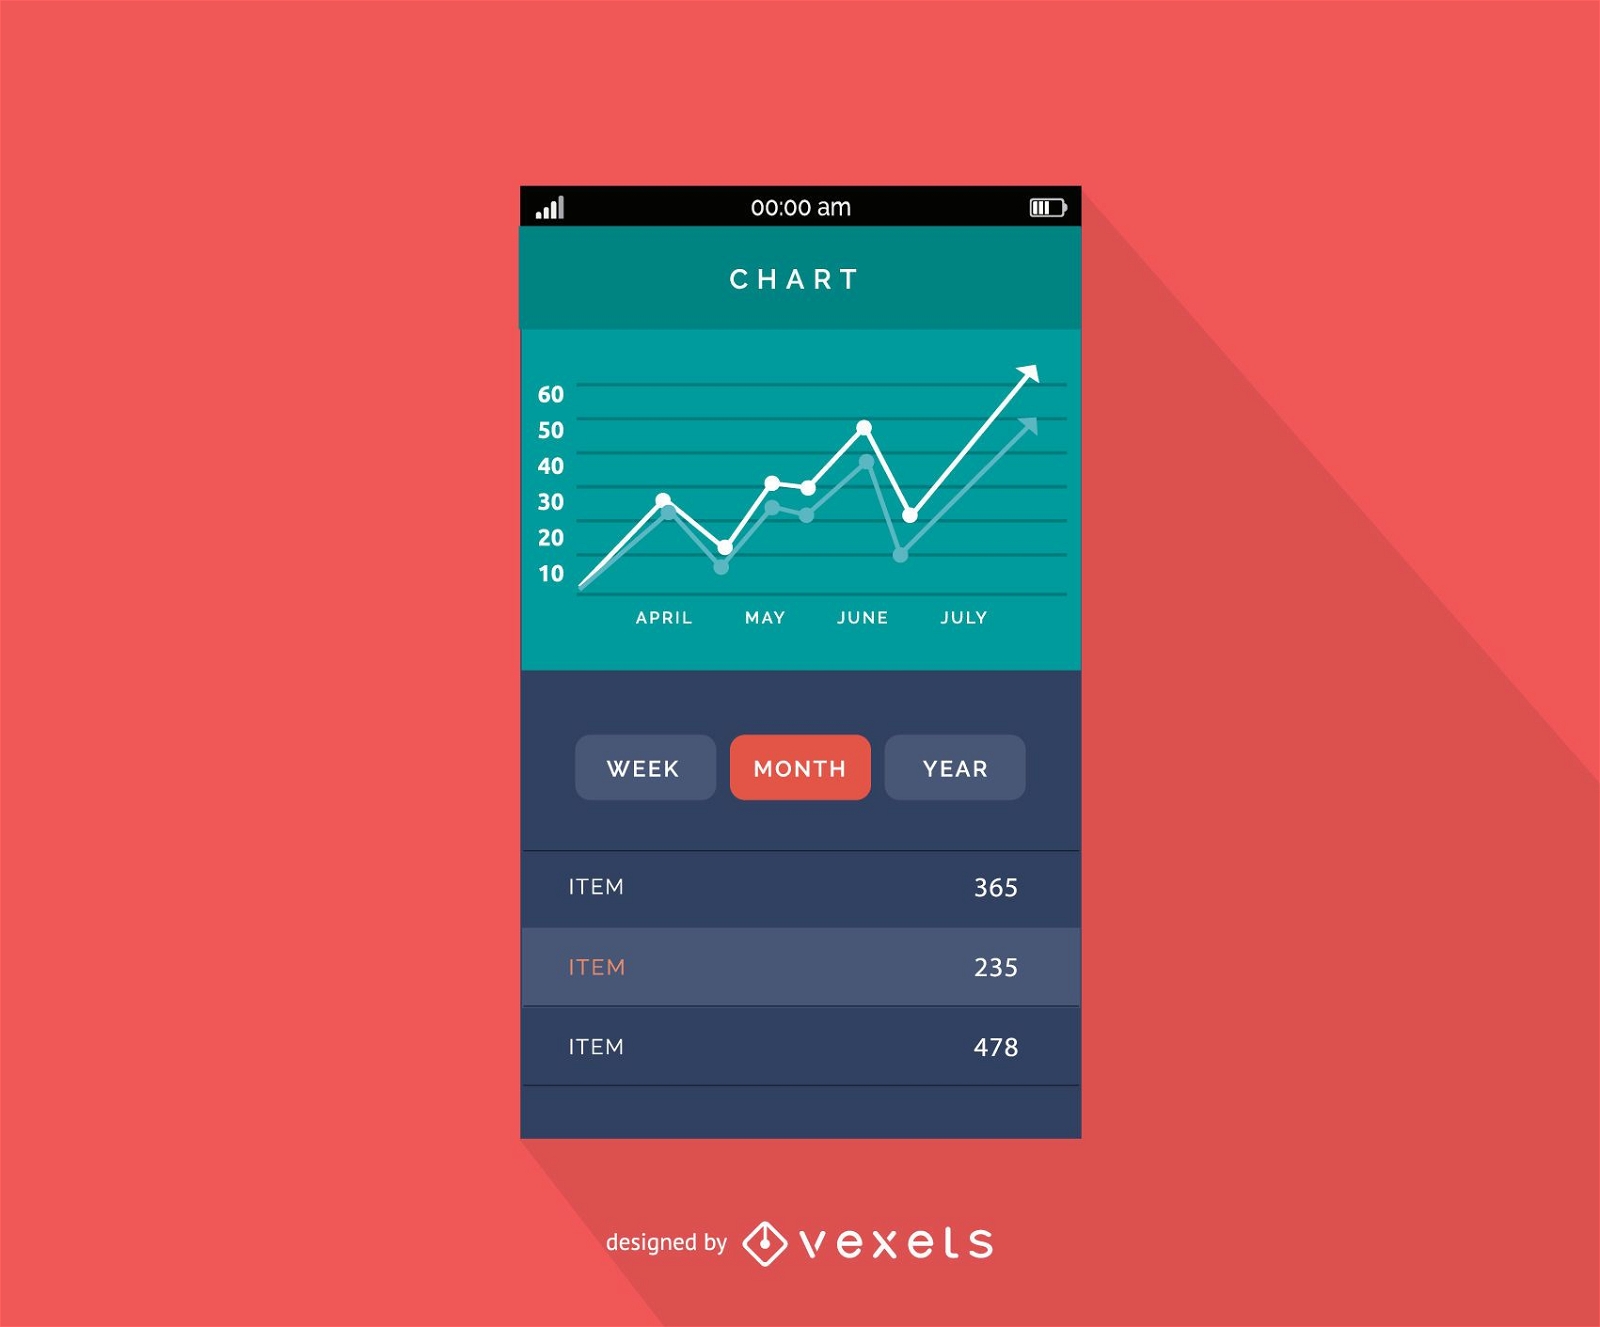
Mobile chart interface design
Choose a folder
All favorites
Create new
Save
Mobile chart interface design
Premium
Math Flat Design Icon Pack
Choose a folder
All favorites
Create new
Save
Math Flat Design Icon Pack
Gaussian bell stroke PNG Design
Choose a folder
All favorites
Create new
Save
Gaussian bell stroke PNG Design
Editable text
Premium
Time money abstract editable design
Choose a folder
All favorites
Create new
Save
Time money abstract editable design
Premium
Two parts bars chart 3 PNG Design
Choose a folder
All favorites
Create new
Save
Two parts bars chart 3 PNG Design
Premium
Golden pie chart PNG Design
Choose a folder
All favorites
Create new
Save
Golden pie chart PNG Design
Blue grey orange piechart PNG Design
Choose a folder
All favorites
Create new
Save
Blue grey orange piechart PNG Design
3 part chirstmas pie chart PNG Design
Choose a folder
All favorites
Create new
Save
3 part chirstmas pie chart PNG Design
3 part pie chart PNG Design
Choose a folder
All favorites
Create new
Save
3 part pie chart PNG Design
Dot plot high school elements PNG Design
Choose a folder
All favorites
Create new
Save
Dot plot high school elements PNG Design
Semicircle triangle stroke PNG Design
Choose a folder
All favorites
Create new
Save
Semicircle triangle stroke PNG Design
Colorful piechart infographic PNG Design
Choose a folder
All favorites
Create new
Save
Colorful piechart infographic PNG Design
Premium
Orange green circles chart PNG Design
Choose a folder
All favorites
Create new
Save
Orange green circles chart PNG Design
Premium
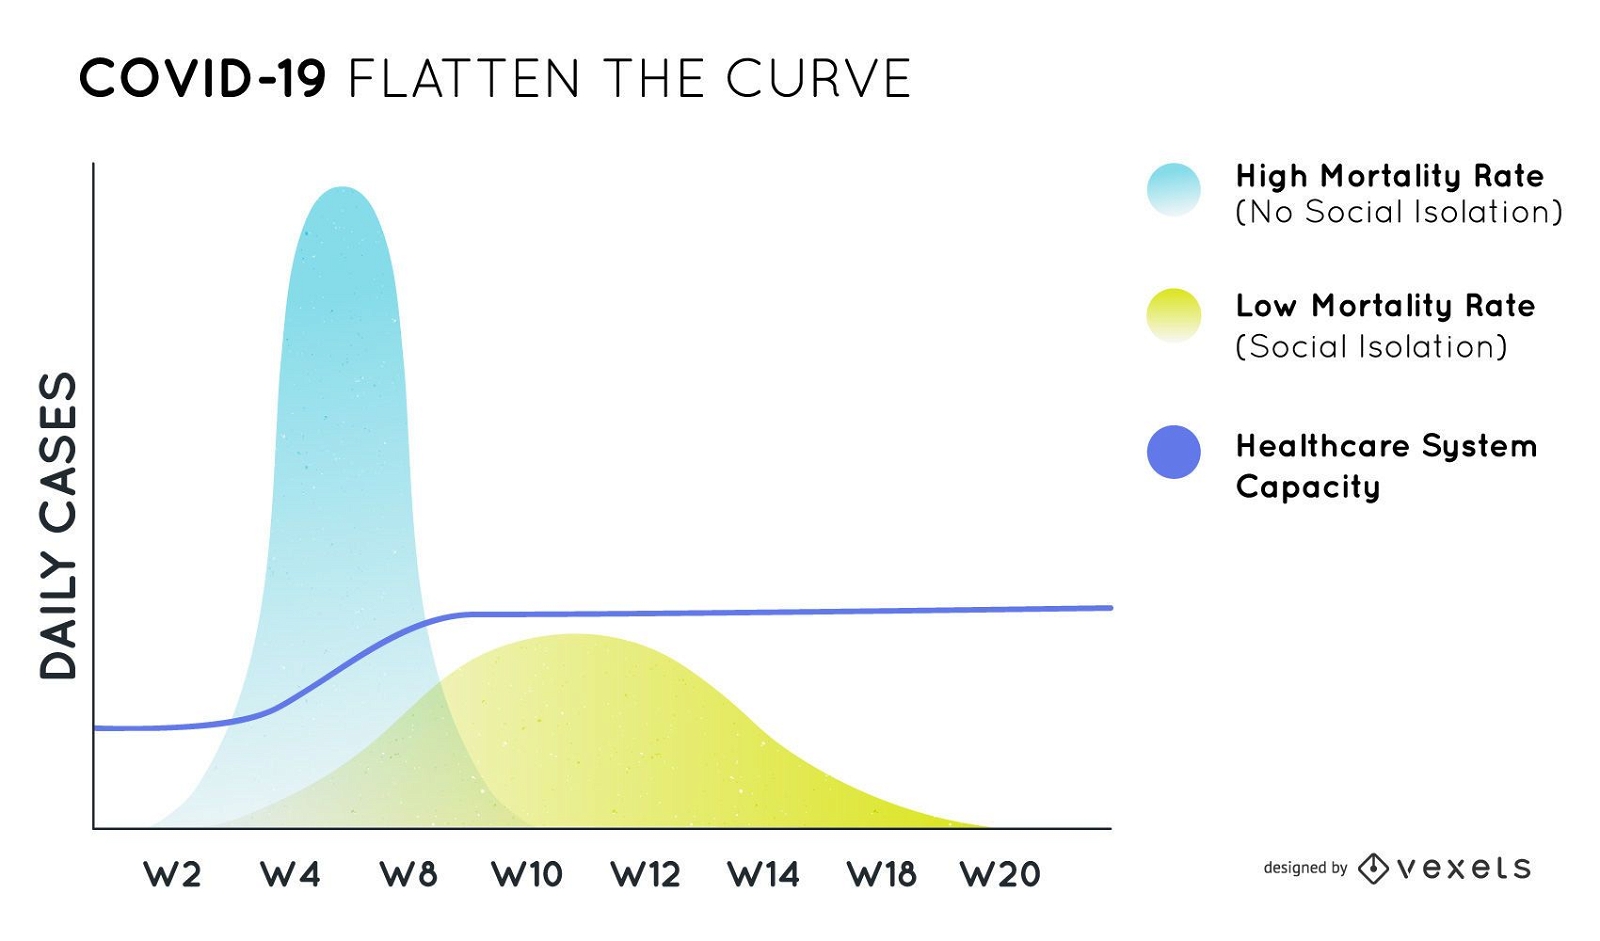
Covid-19 flatten the curve chart design
Choose a folder
All favorites
Create new
Save
Covid-19 flatten the curve chart design
Pie chart hand drawn PNG Design
Choose a folder
All favorites
Create new
Save
Pie chart hand drawn PNG Design
Bars growing arrow icon PNG Design
Choose a folder
All favorites
Create new
Save
Bars growing arrow icon PNG Design
Premium
Green pie chart PNG Design
Choose a folder
All favorites
Create new
Save
Green pie chart PNG Design
Premium
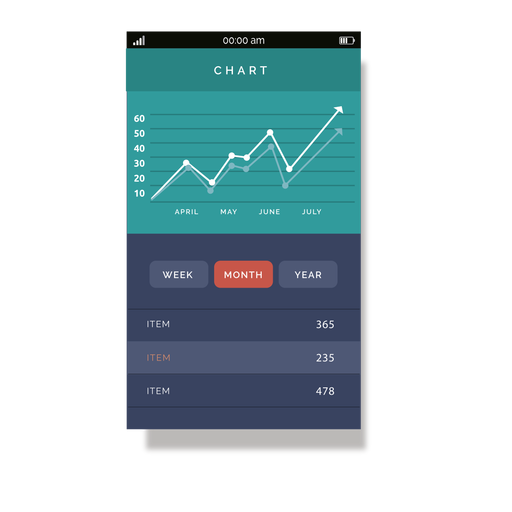
Green mobile chart interface PNG Design
Choose a folder
All favorites
Create new
Save
Green mobile chart interface PNG Design
Premium
Red pie chart PNG Design
Choose a folder
All favorites
Create new
Save
Red pie chart PNG Design
Premium
Half blue multicolor piechart PNG Design
Choose a folder
All favorites
Create new
Save
Half blue multicolor piechart PNG Design
Donut chart hand drawn PNG Design
Choose a folder
All favorites
Create new
Save
Donut chart hand drawn PNG Design
Semicircle triangle flat PNG Design
Choose a folder
All favorites
Create new
Save
Semicircle triangle flat PNG Design
Premium
Blue orange rhomb chart PNG Design
Choose a folder
All favorites
Create new
Save
Blue orange rhomb chart PNG Design
Premium
Piechart infographic PNG Design
Choose a folder
All favorites
Create new
Save
Piechart infographic PNG Design
Large 3d bar chart hand drawing PNG Design
Choose a folder
All favorites
Create new
Save
Large 3d bar chart hand drawing PNG Design
3d bar chart hand drawn PNG Design
Choose a folder
All favorites
Create new
Save
3d bar chart hand drawn PNG Design
Angle school doodle PNG Design
Choose a folder
All favorites
Create new
Save
Angle school doodle PNG Design
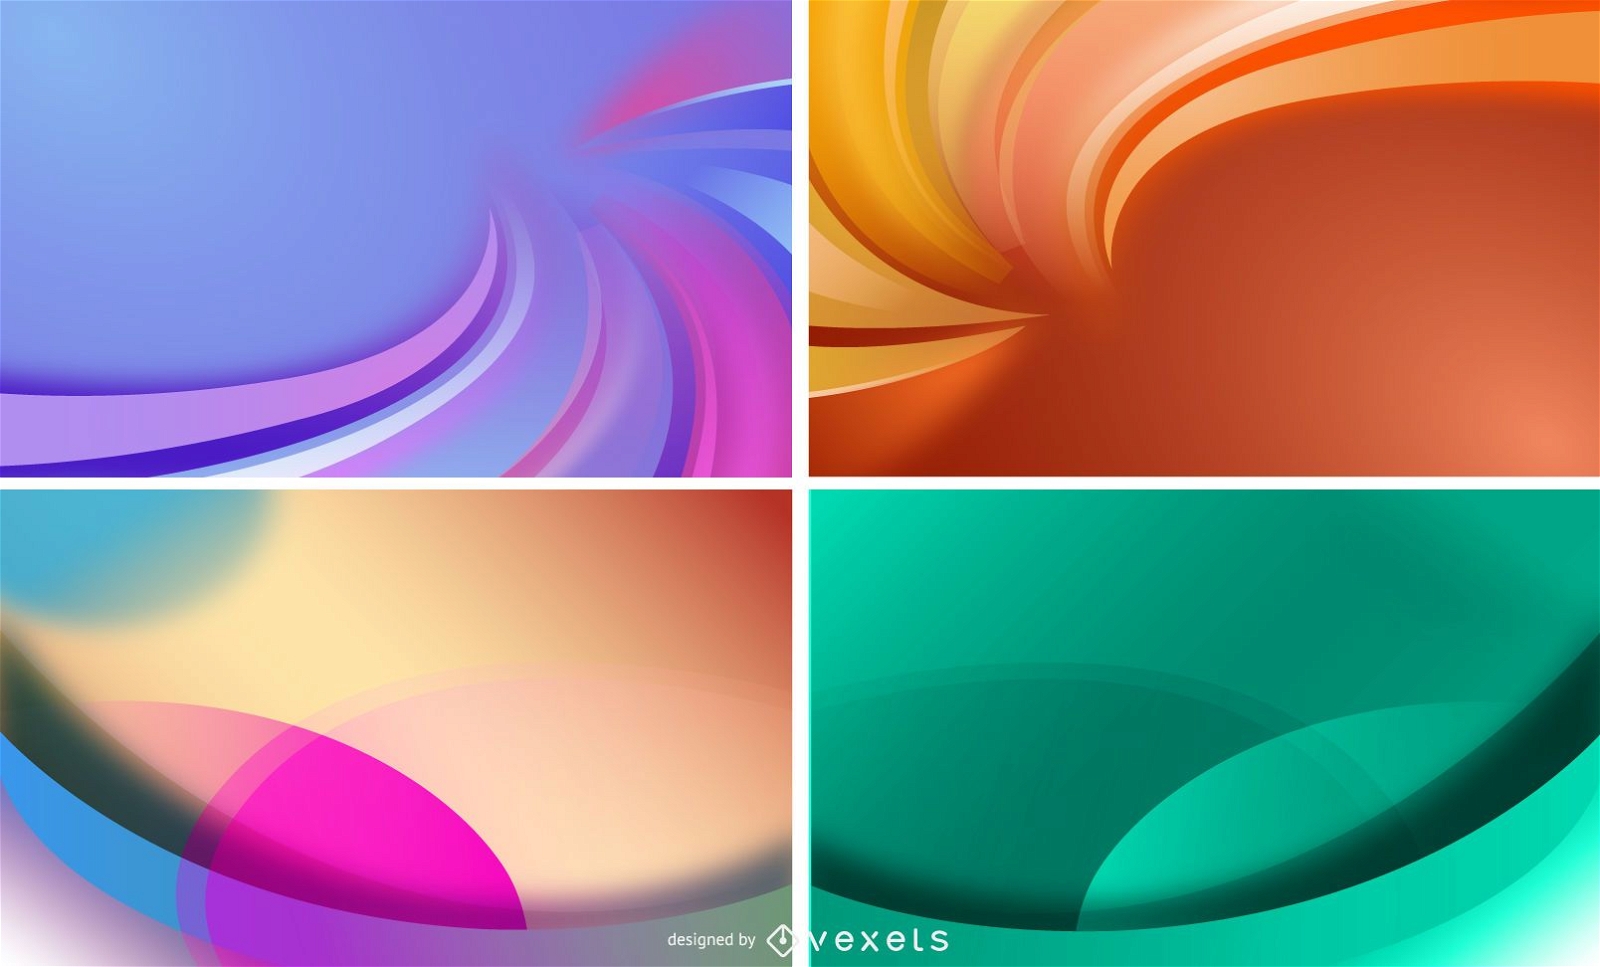
4 Colors Abstract Waves Background Vector Set
Choose a folder
All favorites
Create new
Save
4 Colors Abstract Waves Background Vector Set
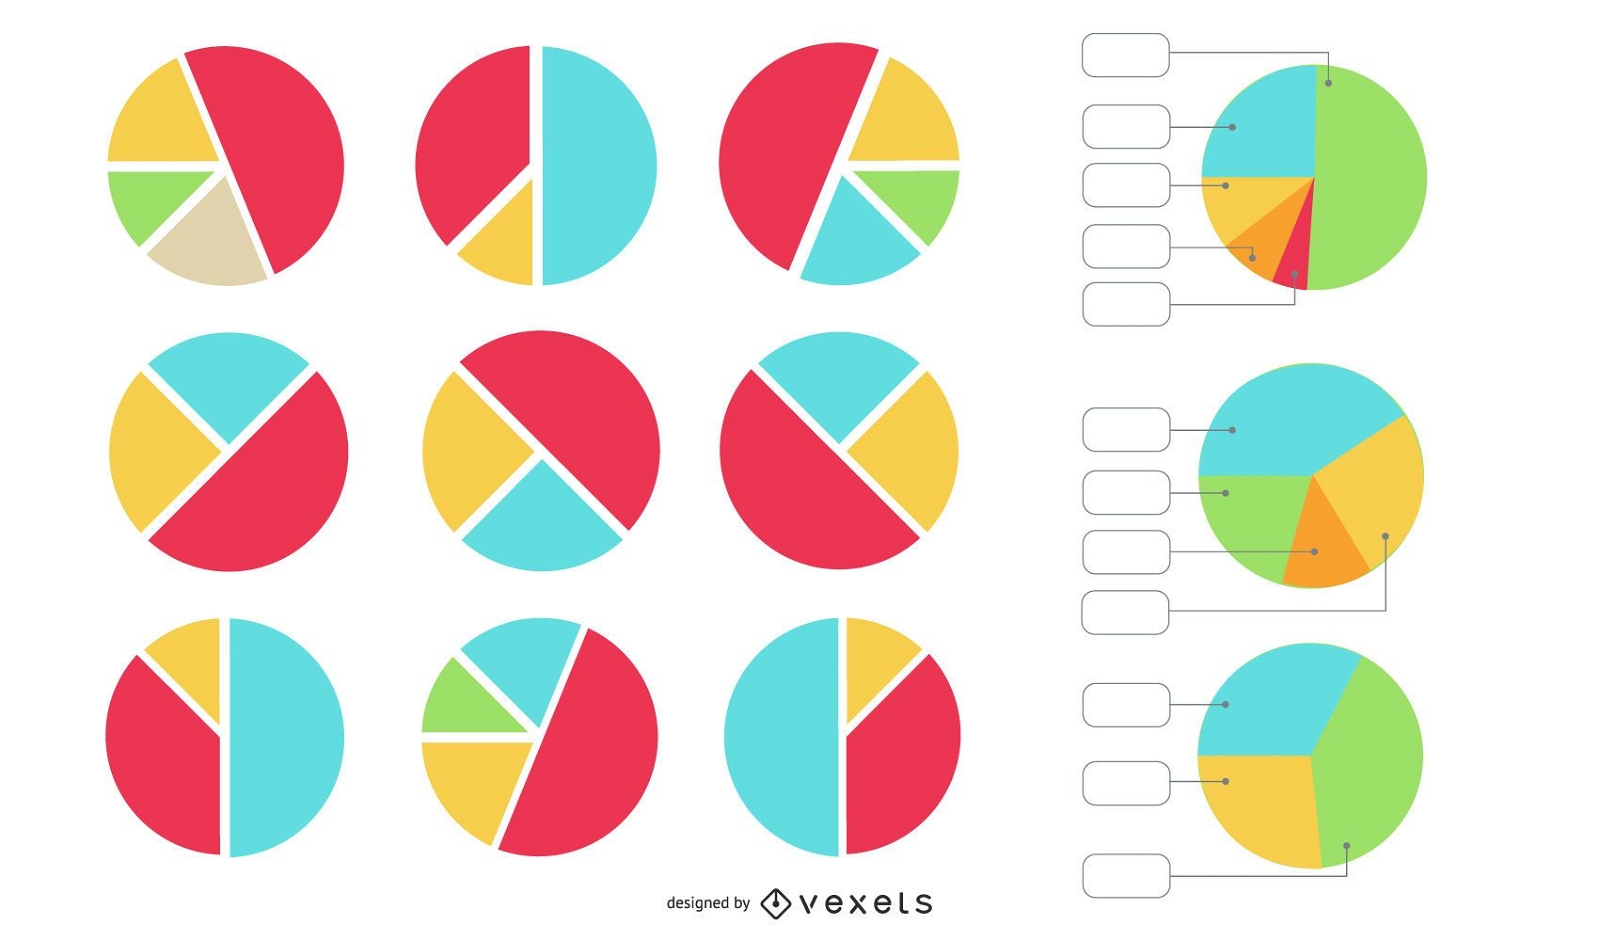
Pie Chart Vector Set
Choose a folder
All favorites
Create new
Save
Pie Chart Vector Set
Finance Investment Icons
Choose a folder
All favorites
Create new
Save
Finance Investment Icons
Business growth success illustration
Choose a folder
All favorites
Create new
Save
Business growth success illustration
Meeting silhouette with businessmen
Choose a folder
All favorites
Create new
Save
Meeting silhouette with businessmen
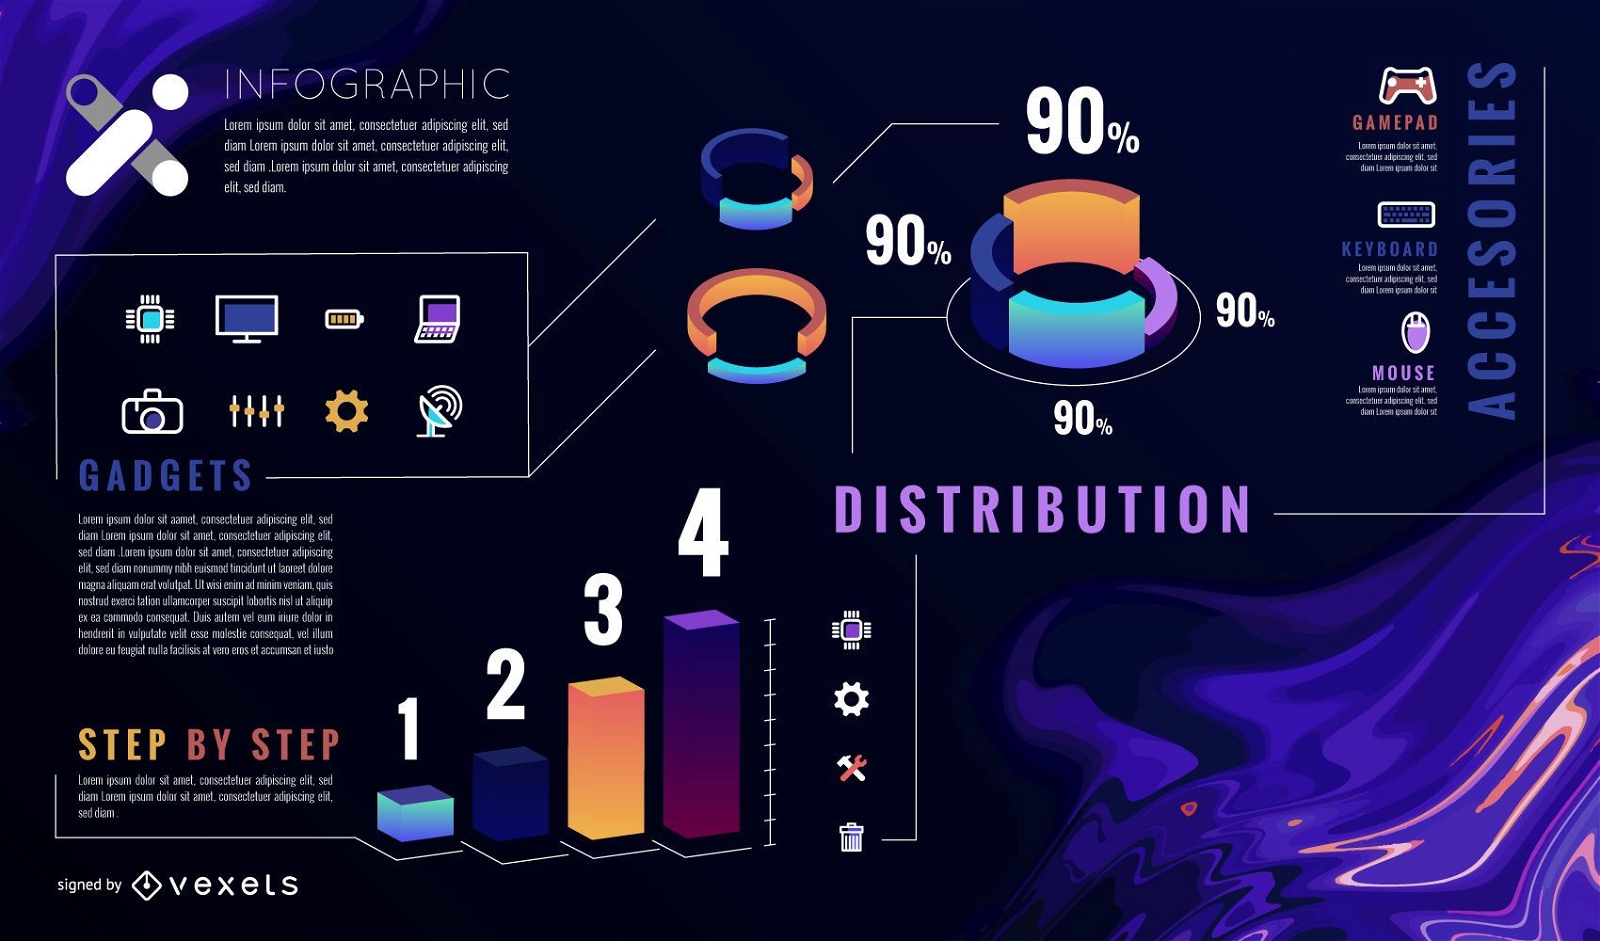
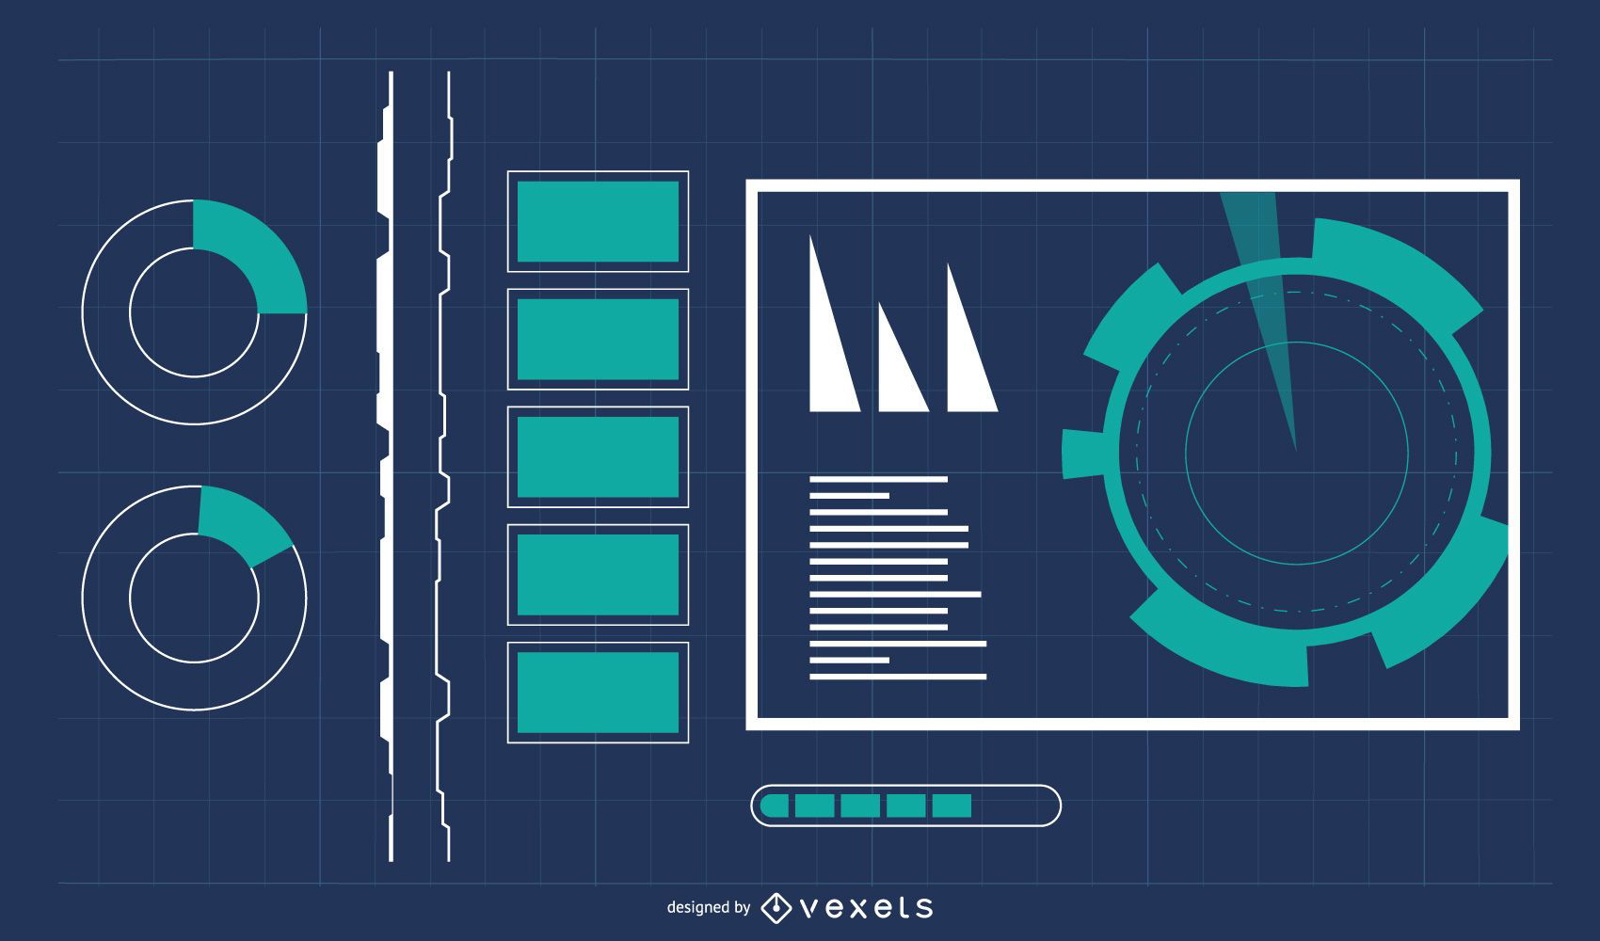
Digital Technology Background with Info-Graphic
Choose a folder
All favorites
Create new
Save
Digital Technology Background with Info-Graphic
Subscribe
To Get High-Quality Commercial Use Designs For Your Business
SEE PLANS
Next
of 8
prev page
next page