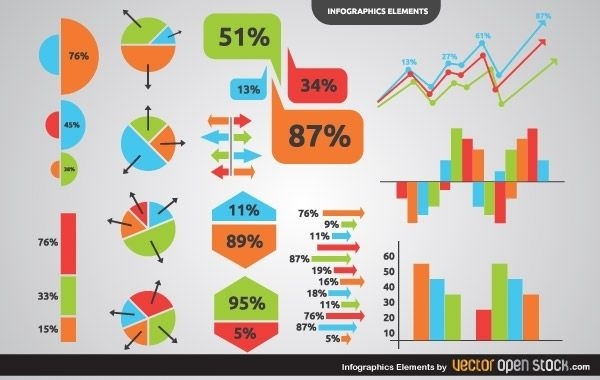
Infographics elements
Graphsbarsinformation graphicals percentages. Several ways of many to show and or report information in detail but in rather a graphical way of showing them. Instead of numerical words pie charts or bar graphs are used to show comparison growth or loss in a certain needed information commonly used in mathematics and accounting purposes. This vector is under Creative Commons Attribution 3.0 License.
10/29/2013
Adobe Illustrator