Design Library
Explore Designs
New Merch Designs
Trending Merch Designs
Vectors
PNGs & SVGs
Mockups
T-Shirts
T-Shirt PSD Templates
KDP Designs
Phone Cases
Pillows
Tote Bags
Posters
Mugs
Design Tools
Designer
New!
T-shirt Maker
Mockup Generator
Quote Generator
Logo Maker
Resources
Merch Digest
Blog
Help Center
Creators Program
Learn About Merch
Changelog
Pricing
Loading...
Sign Up
Login
Vectors
chart
Design Library
Explore Designs
New Merch Designs
Trending Merch Designs
Vectors
PNGs & SVGs
Mockups
T-Shirts
T-Shirt PSD Templates
KDP Designs
Phone Cases
Pillows
Tote Bags
Posters
Mugs
Design Tools
Designer
New!
T-shirt Maker
Mockup Generator
Quote Generator
Logo Maker
Resources
Merch Digest
Blog
Help Center
Creators Program
Learn About Merch
Changelog
PLANS
Vectors
chart
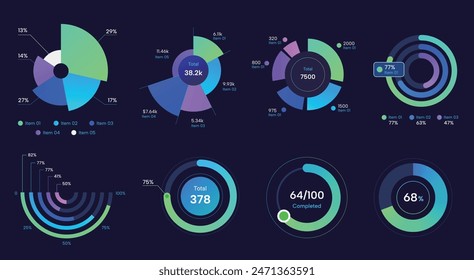
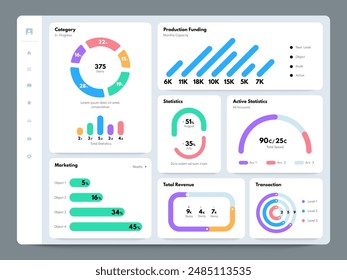
233 chart Vectors & Graphics to Download
Download chart editable vector graphics for every design project. In AI, SVG, PNG, JPG and PSD.
Related:
charts
,
pie chart
,
pie charts
Sort by
Most relevant
Sponsored results by
Get 15% off with code: VEXELS15
Show more
Medical element set
Choose a folder
All favorites
Create new
Save
Medical element set
Businessman showing growing charts
Choose a folder
All favorites
Create new
Save
Businessman showing growing charts
Glossy Colorful Infographic Elements
Choose a folder
All favorites
Create new
Save
Glossy Colorful Infographic Elements
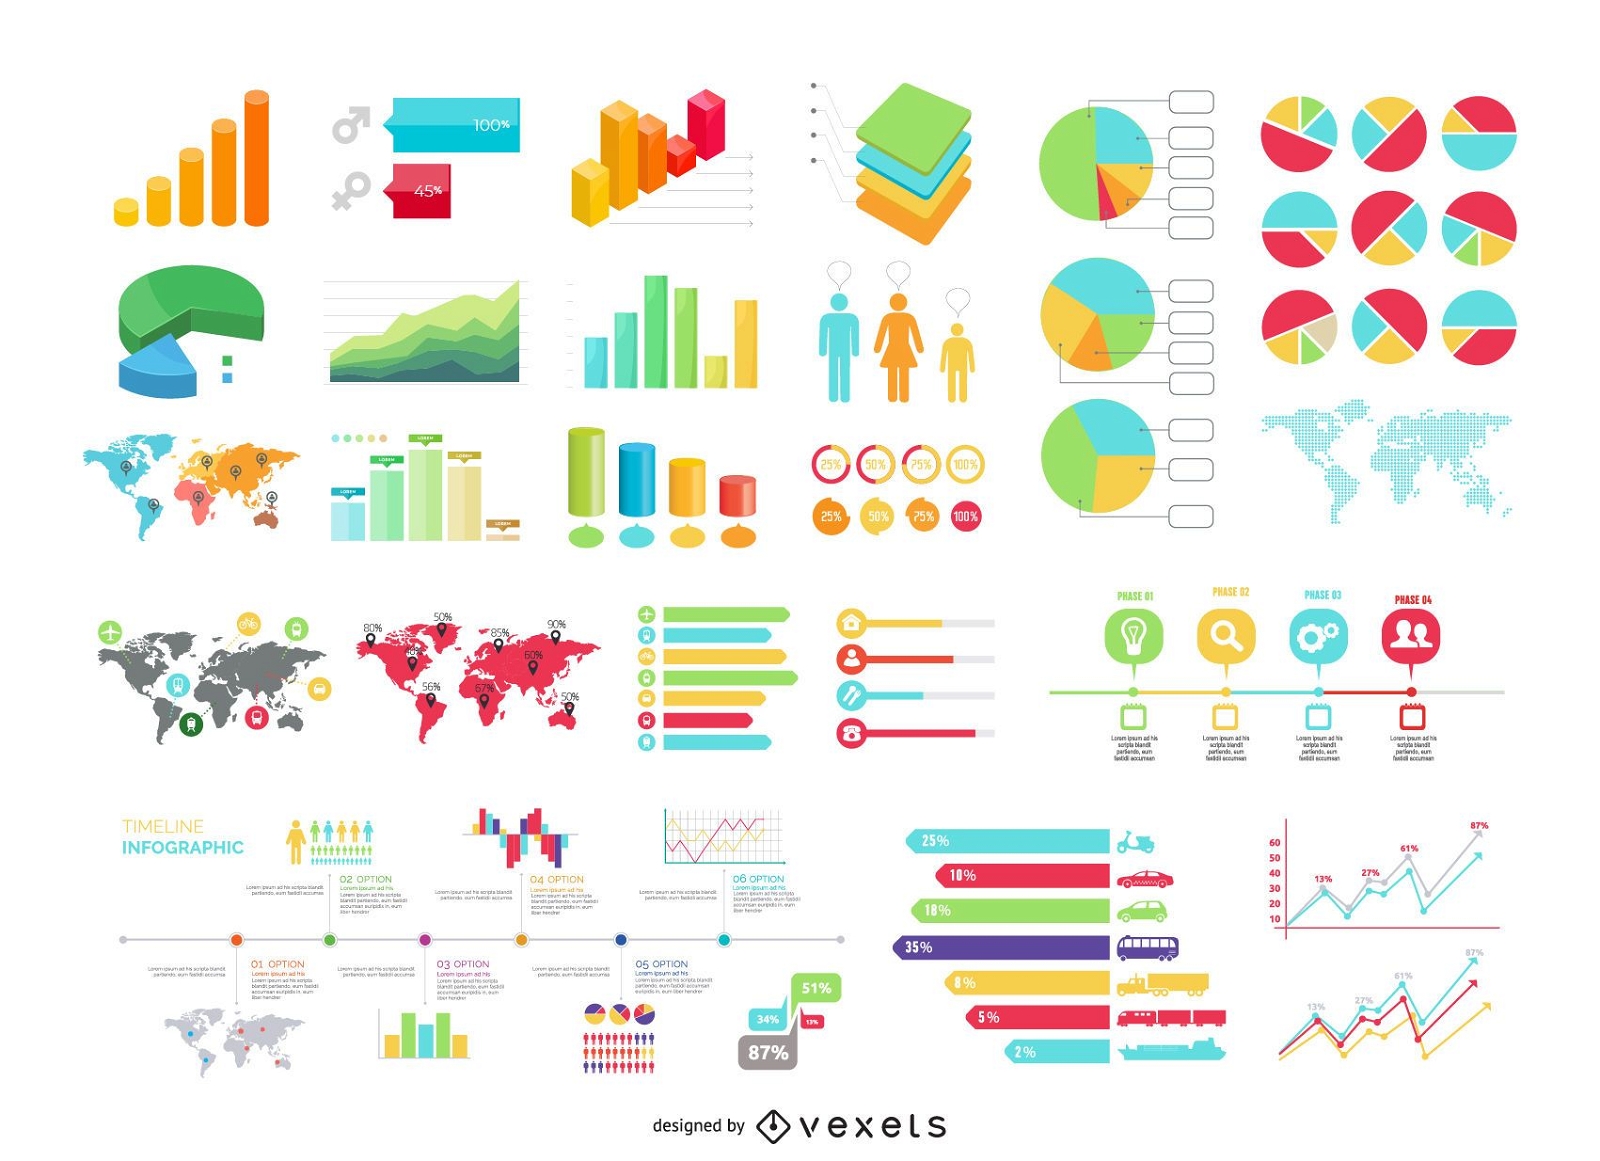
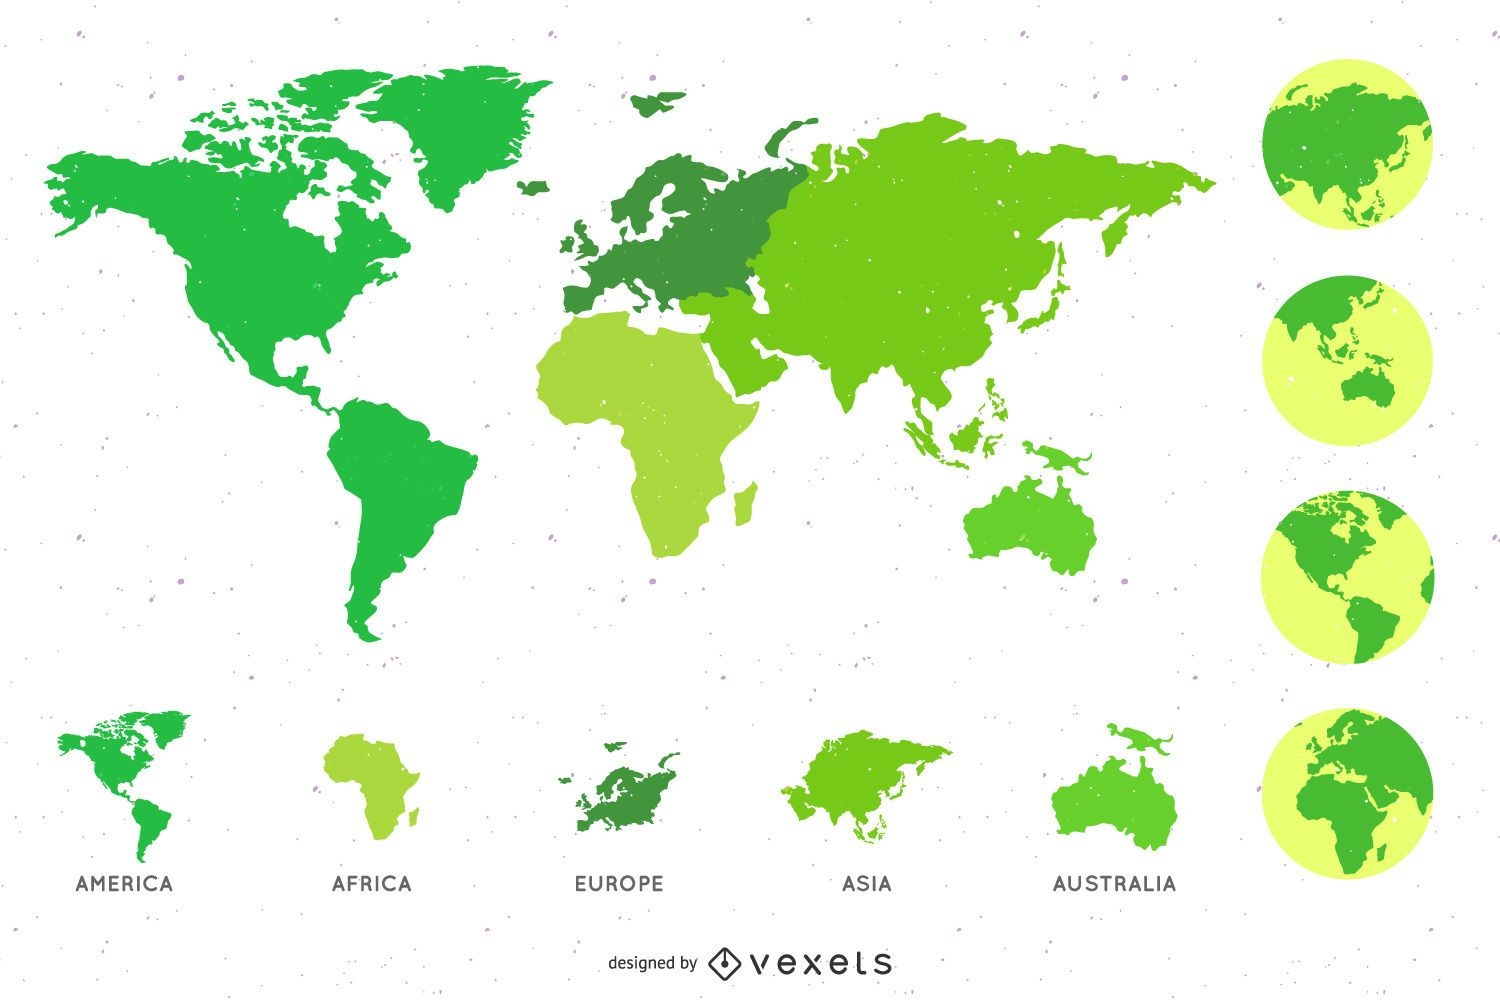
30 Plus Info Graphic Set with Maps and Statistics
Choose a folder
All favorites
Create new
Save
30 Plus Info Graphic Set with Maps and Statistics
Big idea hand drawn design
Choose a folder
All favorites
Create new
Save
Big idea hand drawn design
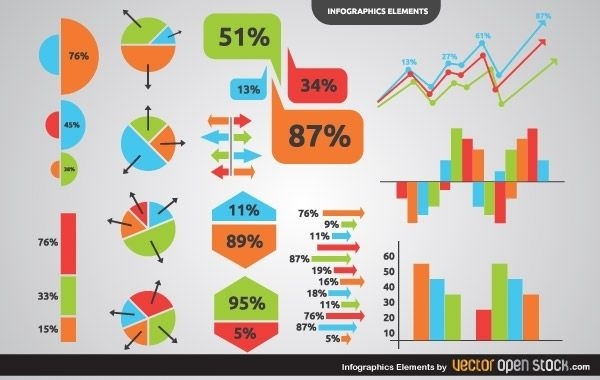
Infographics elements
Choose a folder
All favorites
Create new
Save
Infographics elements
Business doodle hand drawn elements
Choose a folder
All favorites
Create new
Save
Business doodle hand drawn elements
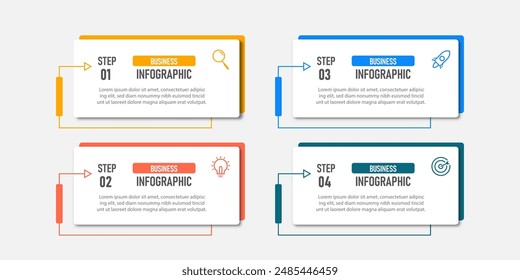
Creative Statistic Charts Infographic Set
Choose a folder
All favorites
Create new
Save
Creative Statistic Charts Infographic Set
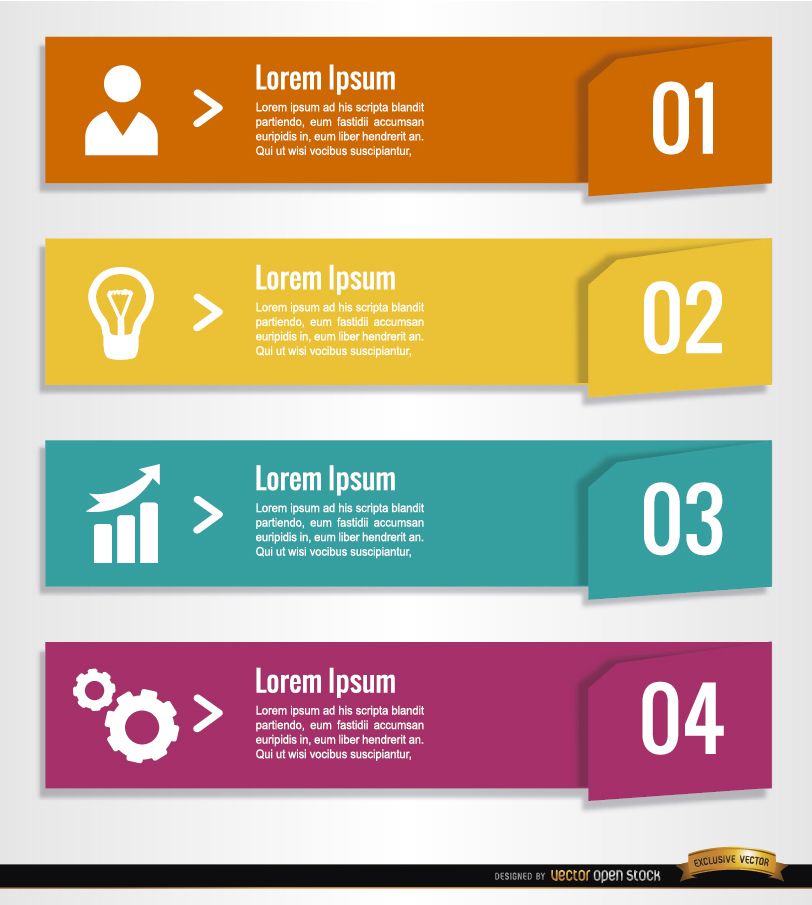
4 Business bookmark banners
Choose a folder
All favorites
Create new
Save
4 Business bookmark banners
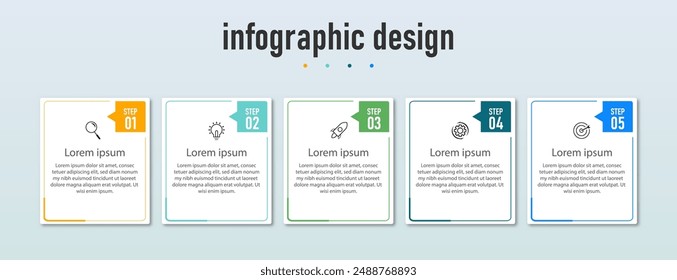
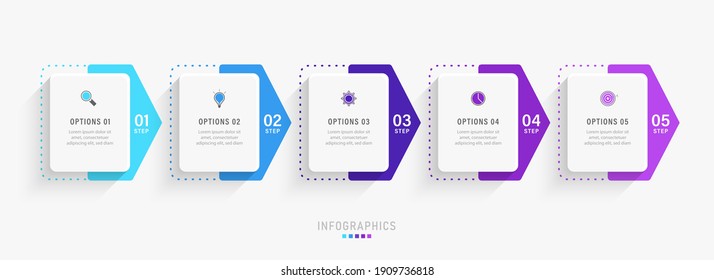
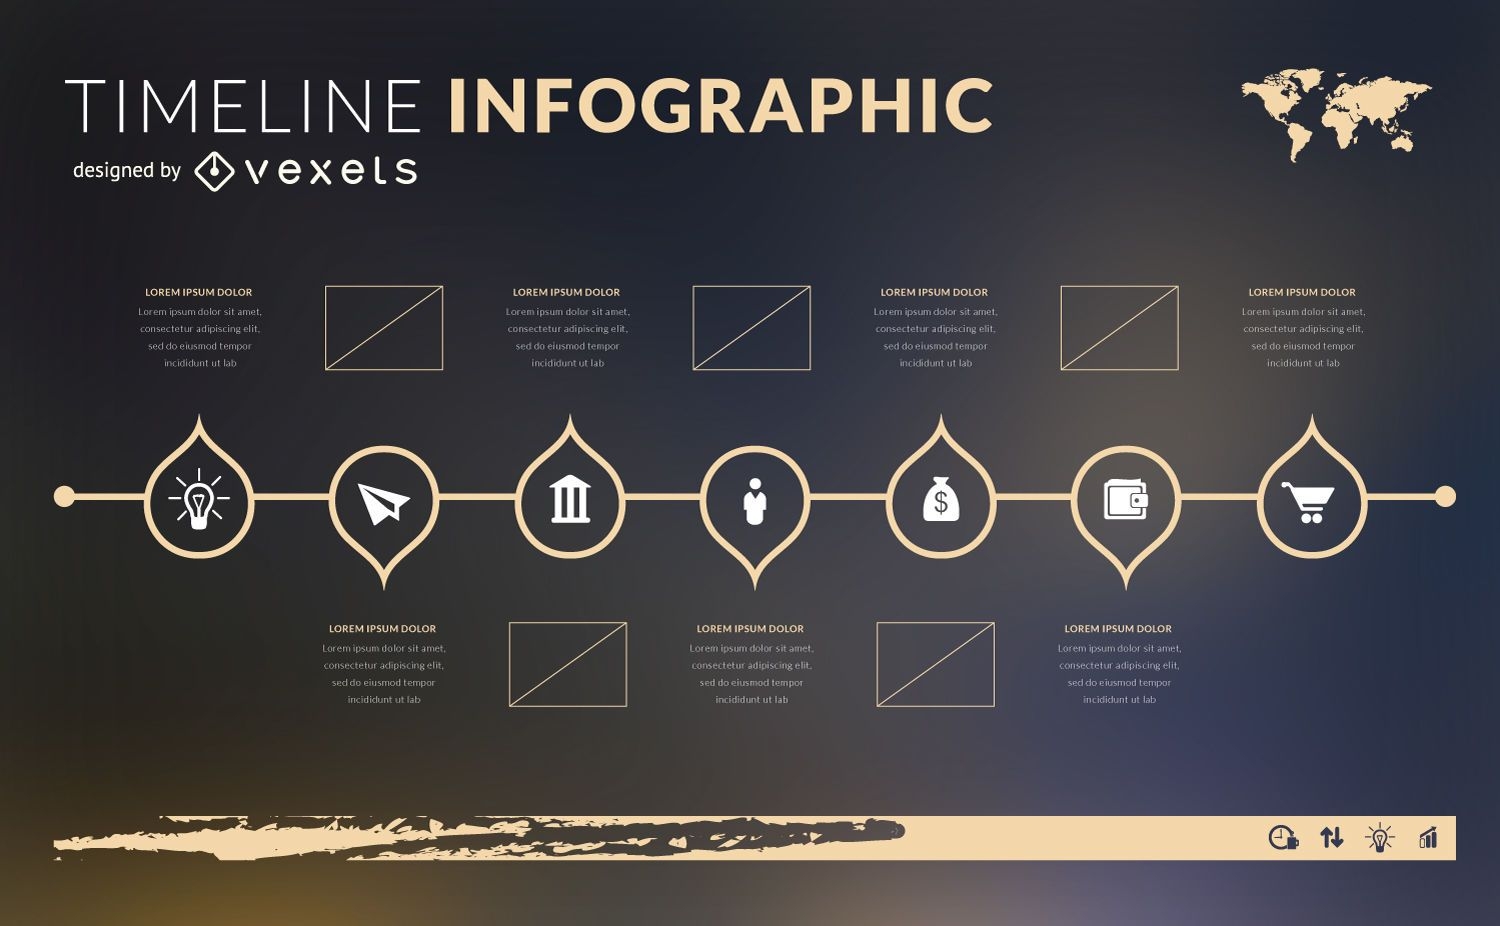
Flat design timeline infographic template
Choose a folder
All favorites
Create new
Save
Flat design timeline infographic template
Timeline infographic template
Choose a folder
All favorites
Create new
Save
Timeline infographic template
Social clouds infographic people group opinions
Choose a folder
All favorites
Create new
Save
Social clouds infographic people group opinions
Premium
Animal Themed Alphabet Set
Choose a folder
All favorites
Create new
Save
Animal Themed Alphabet Set
Flat & 3D Colorful Infographic Set
Choose a folder
All favorites
Create new
Save
Flat & 3D Colorful Infographic Set
Editable text
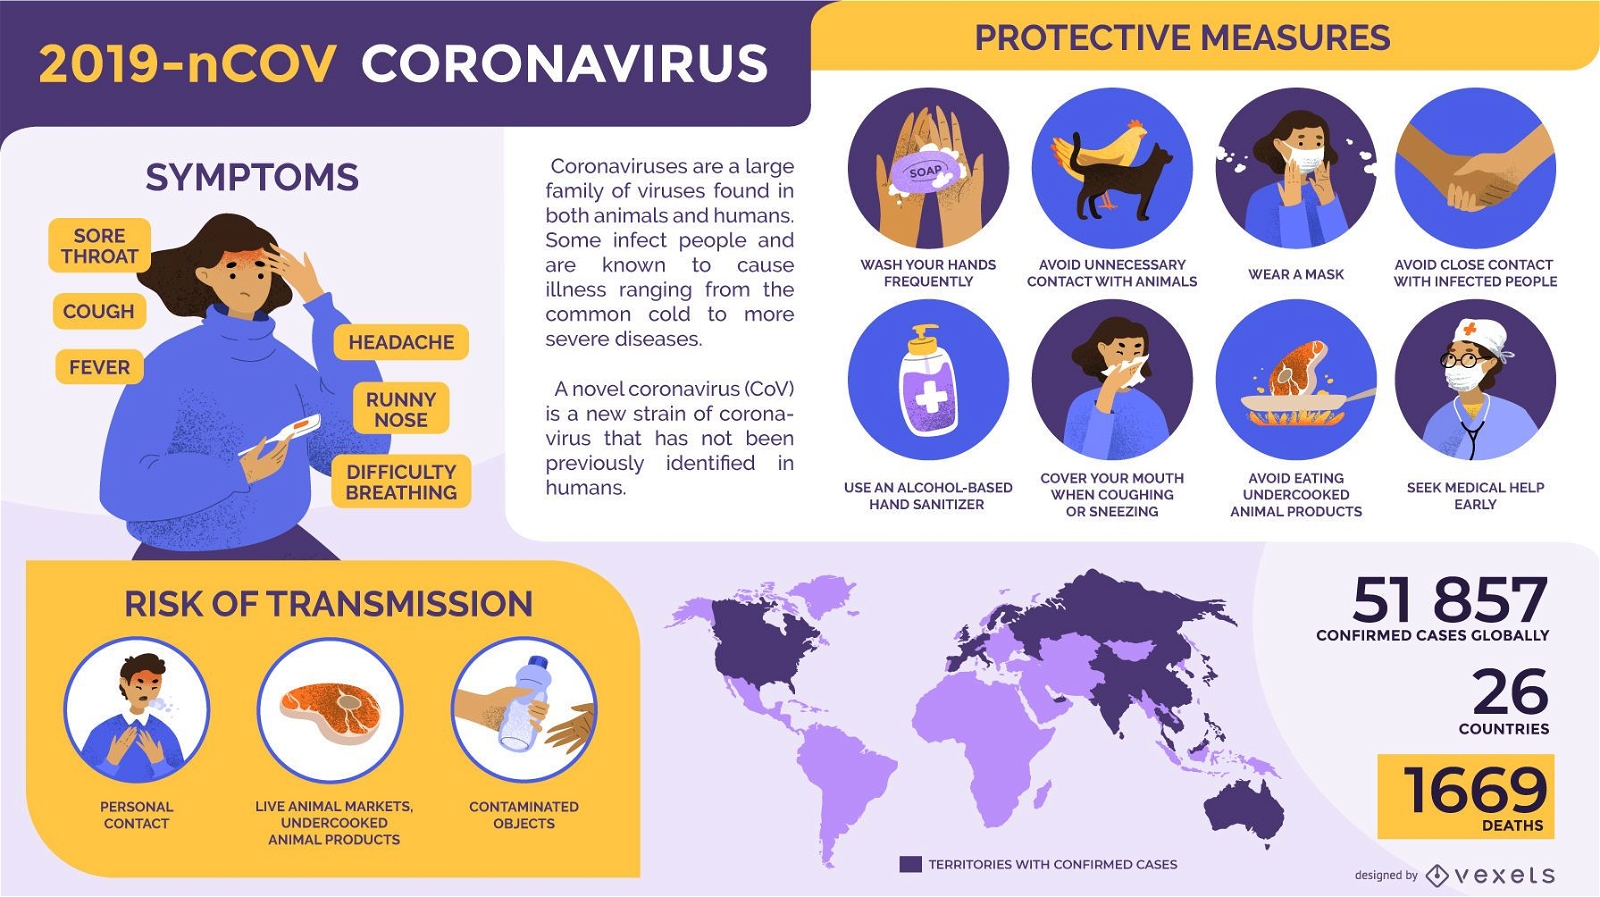
Coronavirus infographic template
Choose a folder
All favorites
Create new
Save
Coronavirus infographic template
Premium
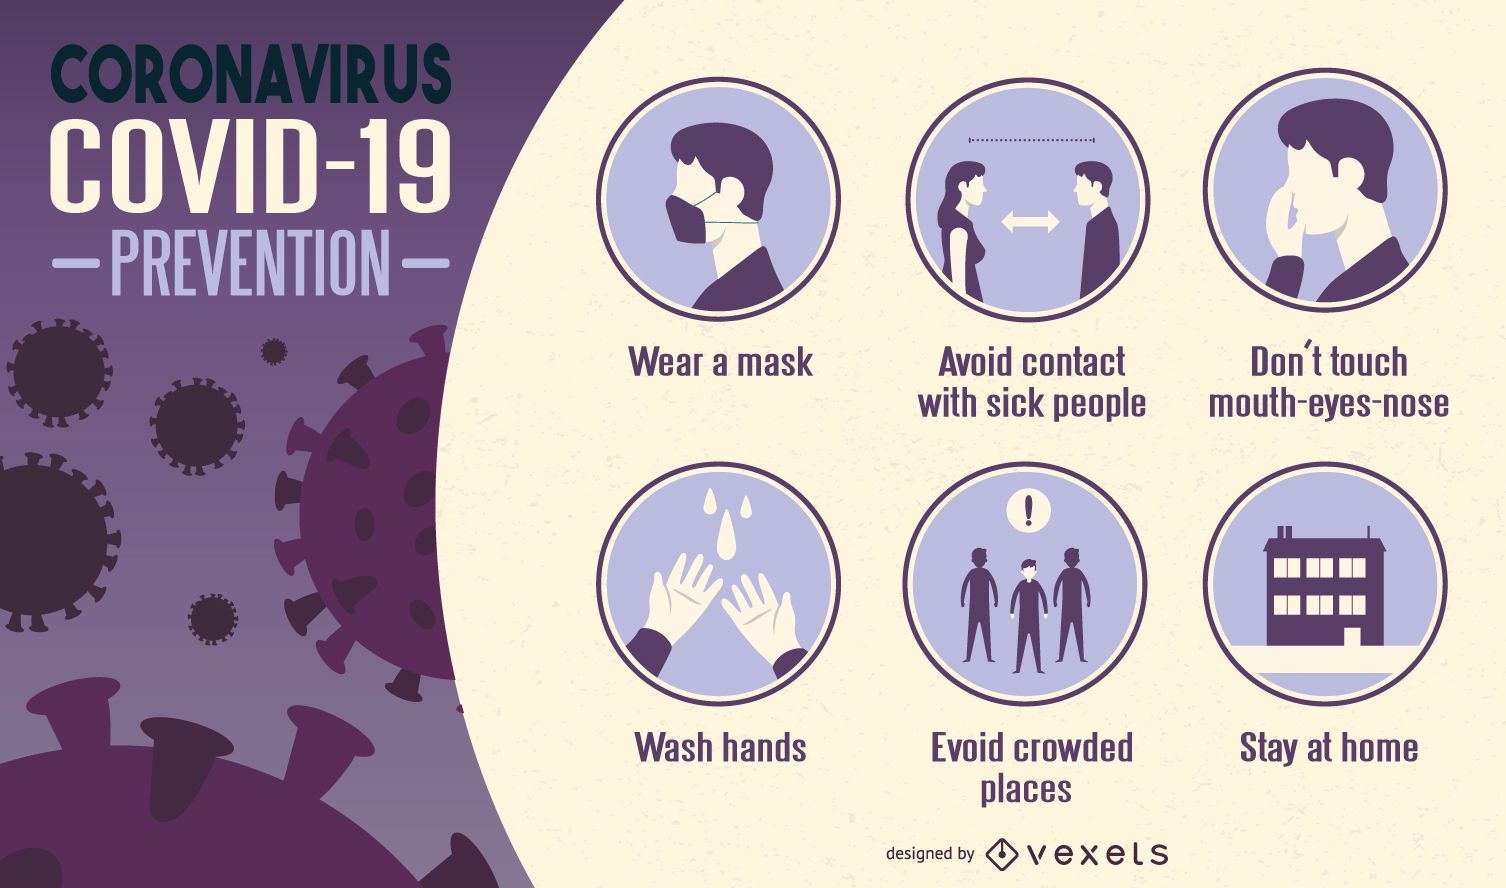
Coronavirus prevention infographic
Choose a folder
All favorites
Create new
Save
Coronavirus prevention infographic
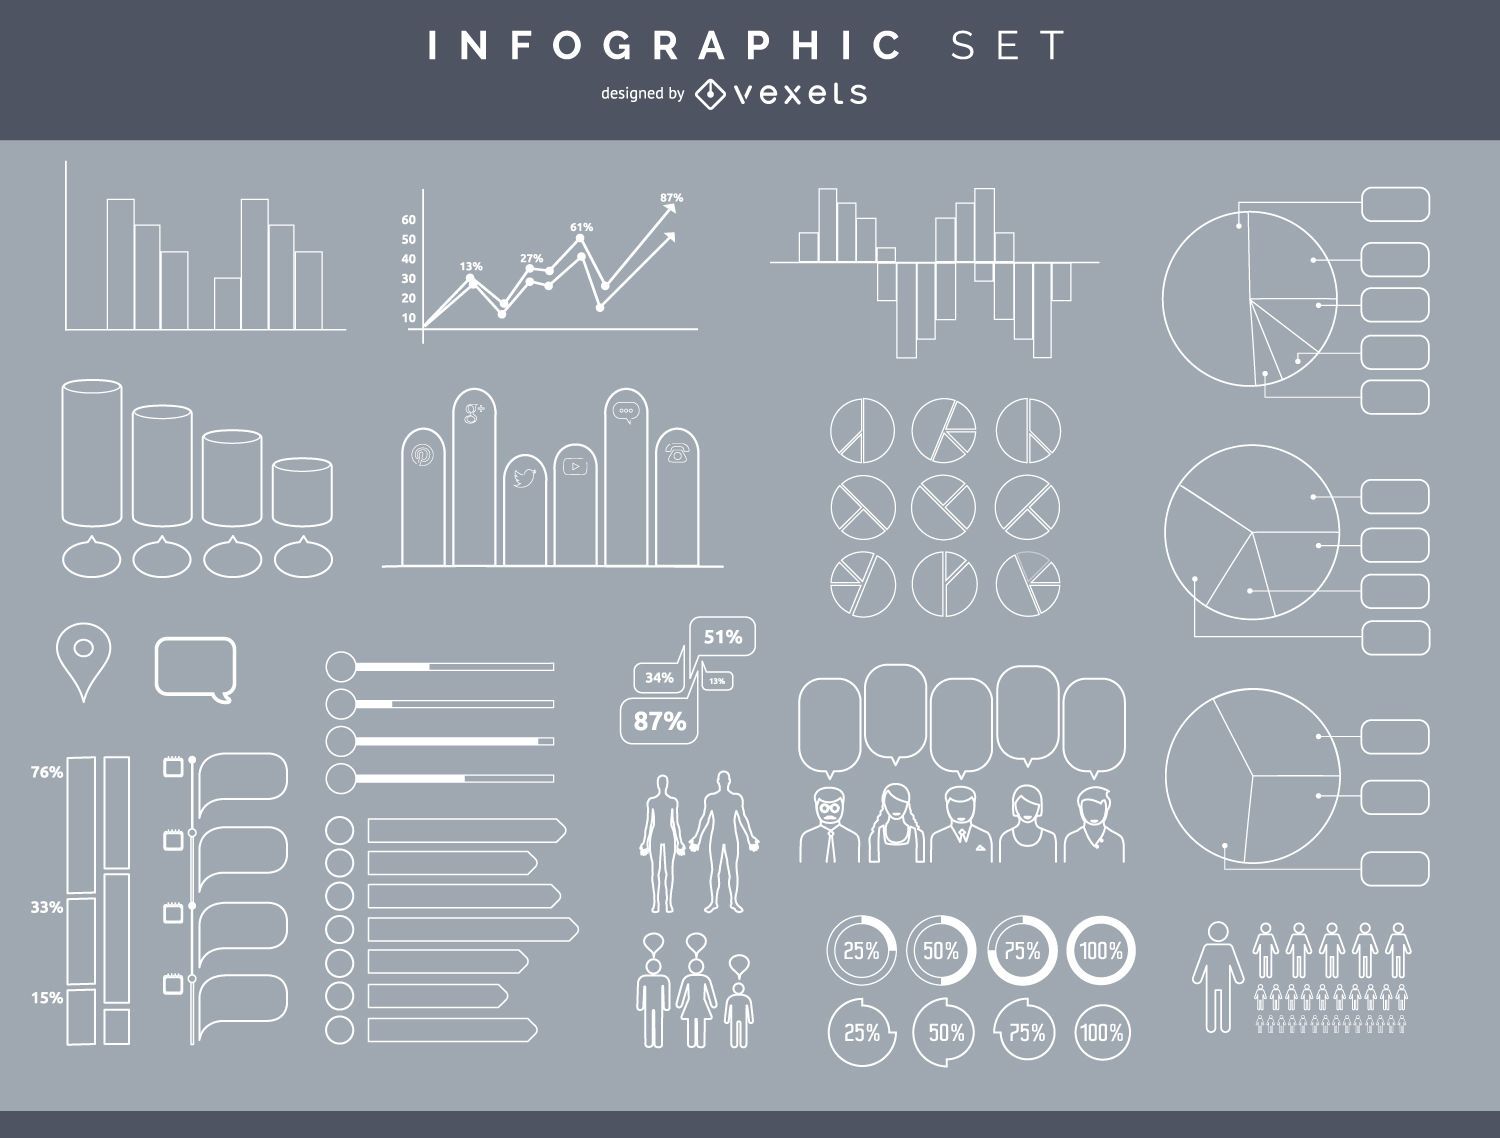
Infographic element set
Choose a folder
All favorites
Create new
Save
Infographic element set
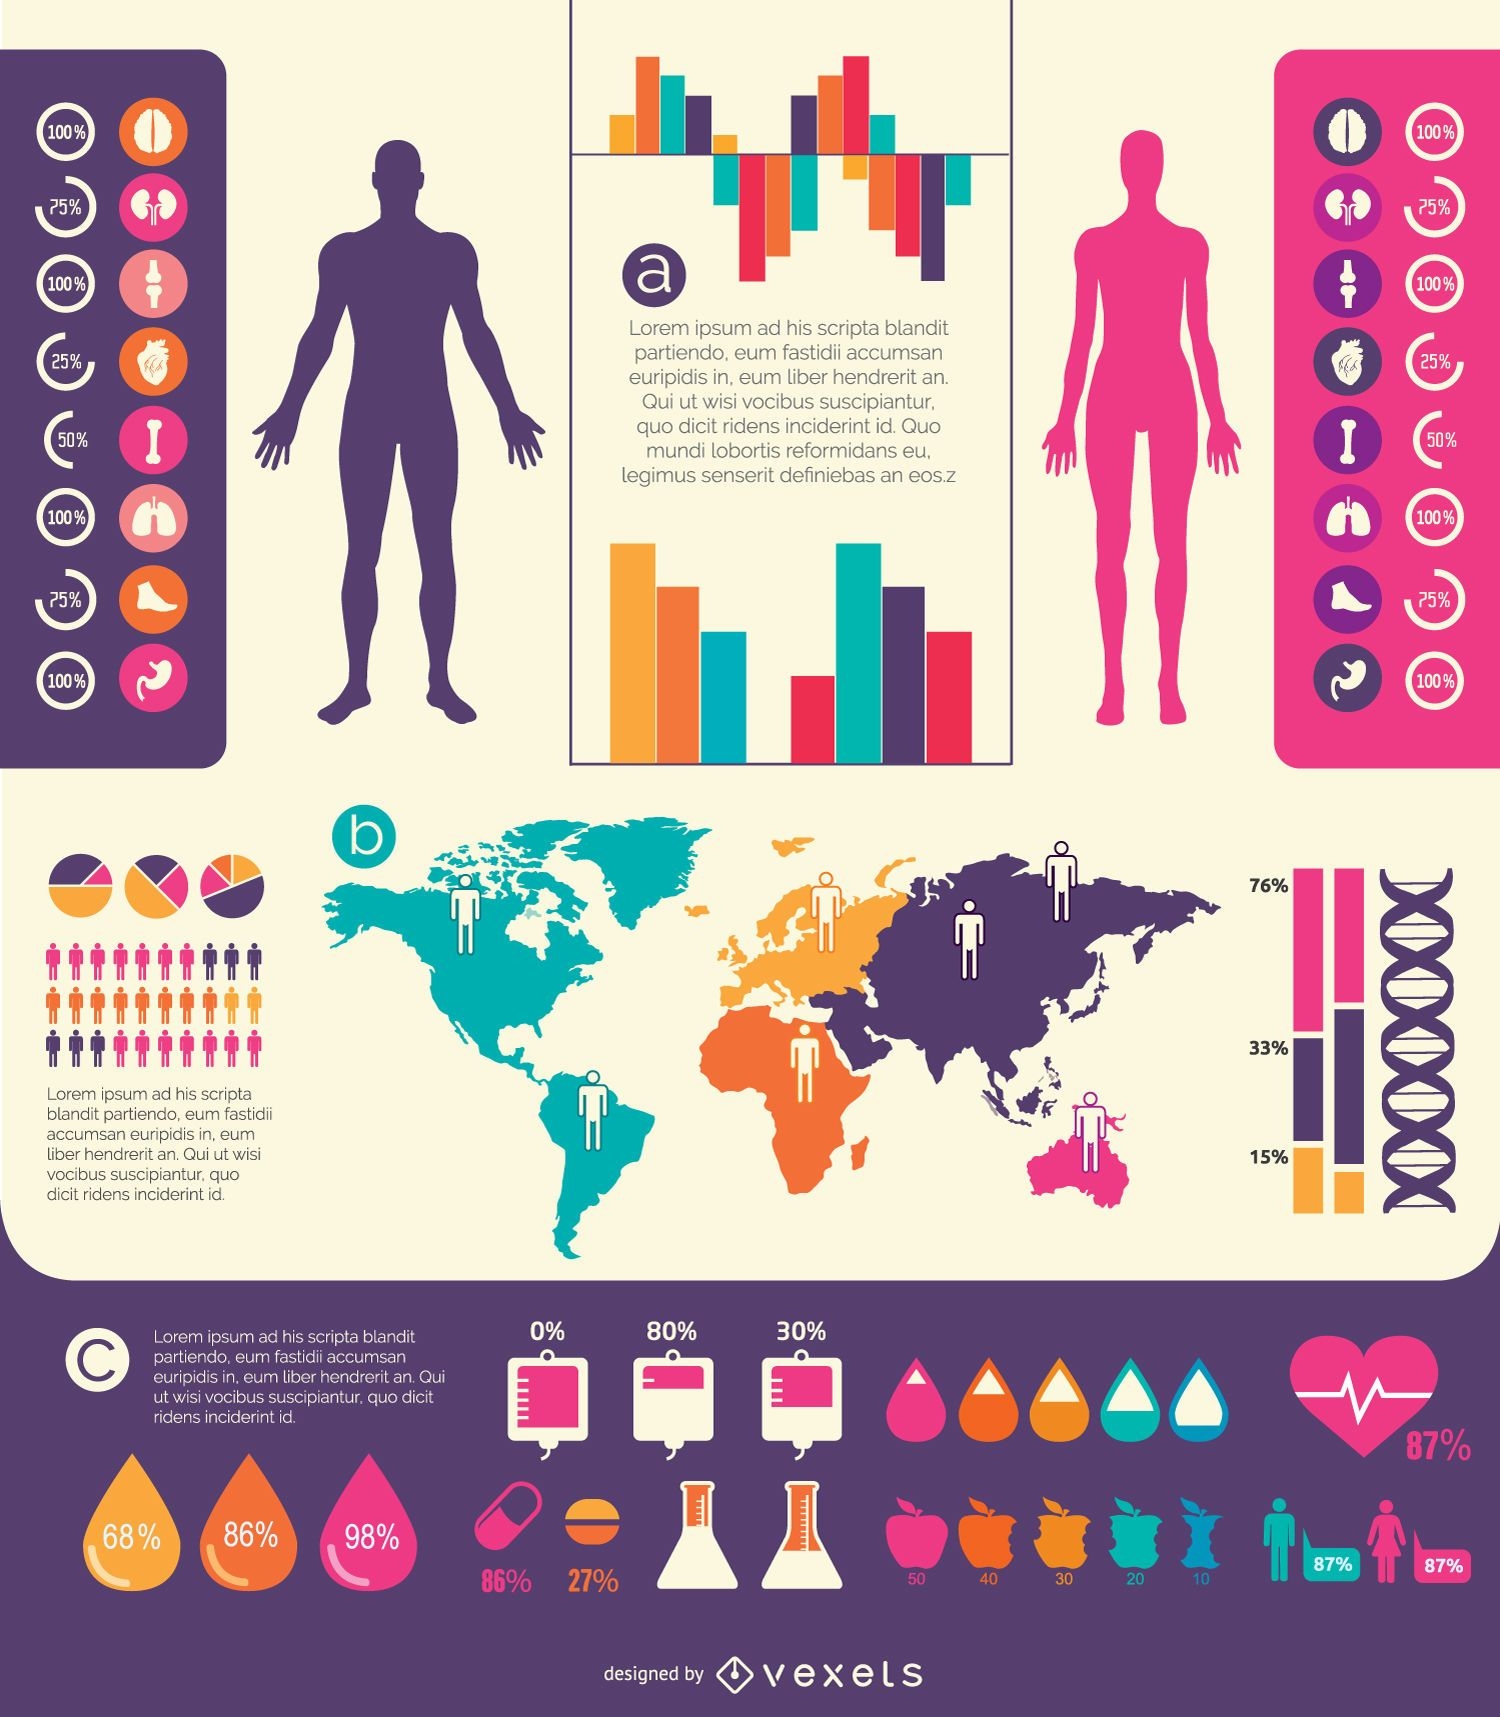
Healthcare Medical Infographics
Choose a folder
All favorites
Create new
Save
Healthcare Medical Infographics
Infographic social clouds concept man ideas
Choose a folder
All favorites
Create new
Save
Infographic social clouds concept man ideas
Modern Earth Background Design
Choose a folder
All favorites
Create new
Save
Modern Earth Background Design
Premium
Monster Themed Alphabet Set
Choose a folder
All favorites
Create new
Save
Monster Themed Alphabet Set
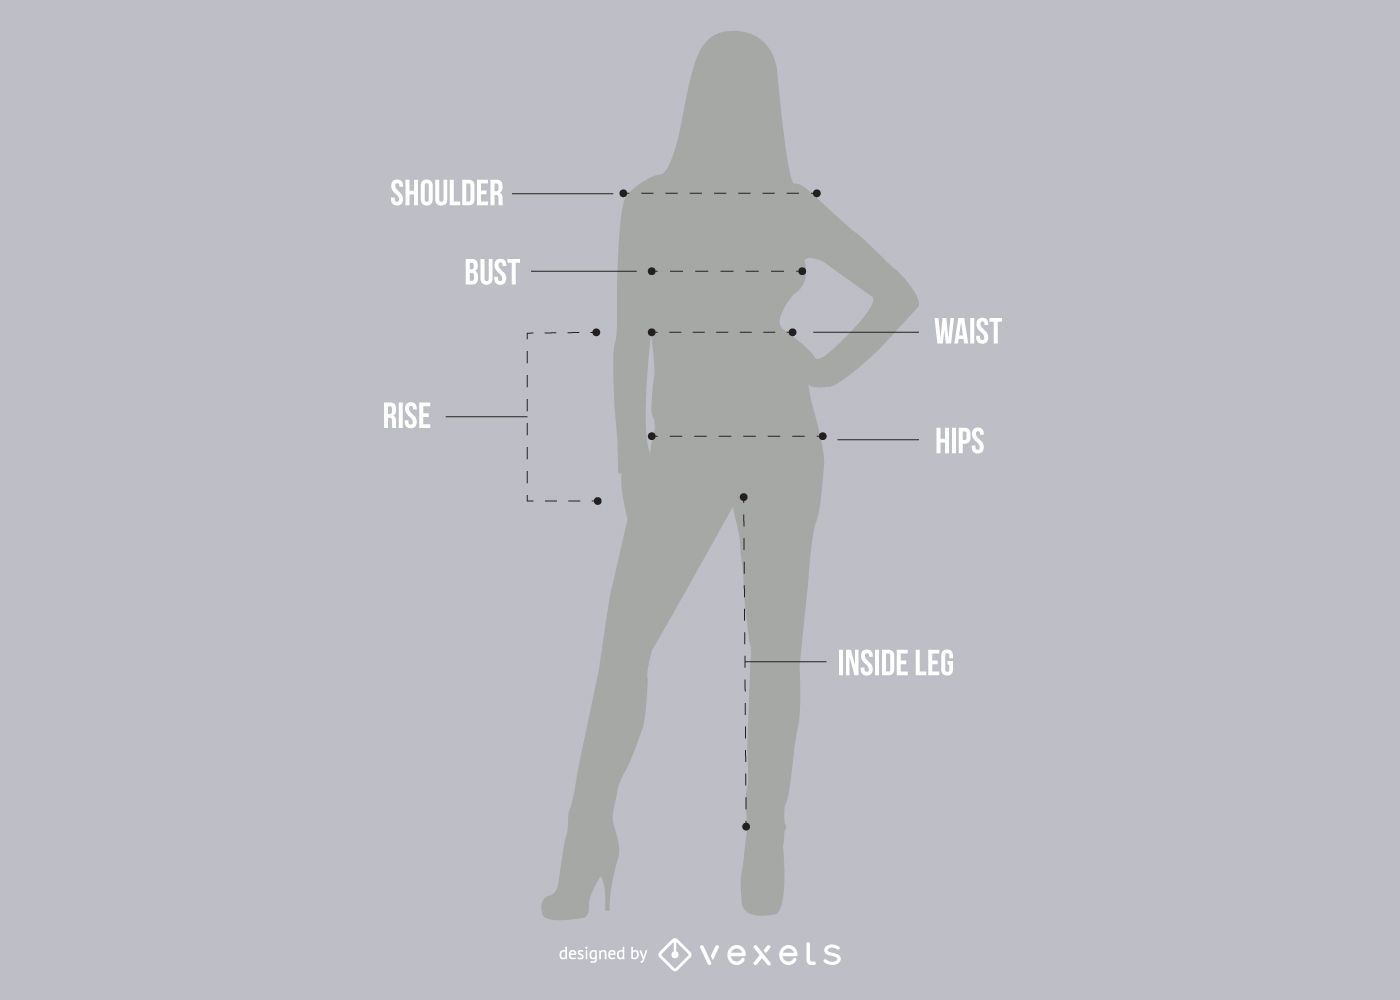
Women Measurement Guide
Choose a folder
All favorites
Create new
Save
Women Measurement Guide
Transport & Trafic Infographic
Choose a folder
All favorites
Create new
Save
Transport & Trafic Infographic
20 Economy circle iconss
Choose a folder
All favorites
Create new
Save
20 Economy circle iconss
Creative meeting with smart devices
Choose a folder
All favorites
Create new
Save
Creative meeting with smart devices
Thin line marketing icon set
Choose a folder
All favorites
Create new
Save
Thin line marketing icon set
20 financial circle icons
Choose a folder
All favorites
Create new
Save
20 financial circle icons
Growing Profits
Choose a folder
All favorites
Create new
Save
Growing Profits
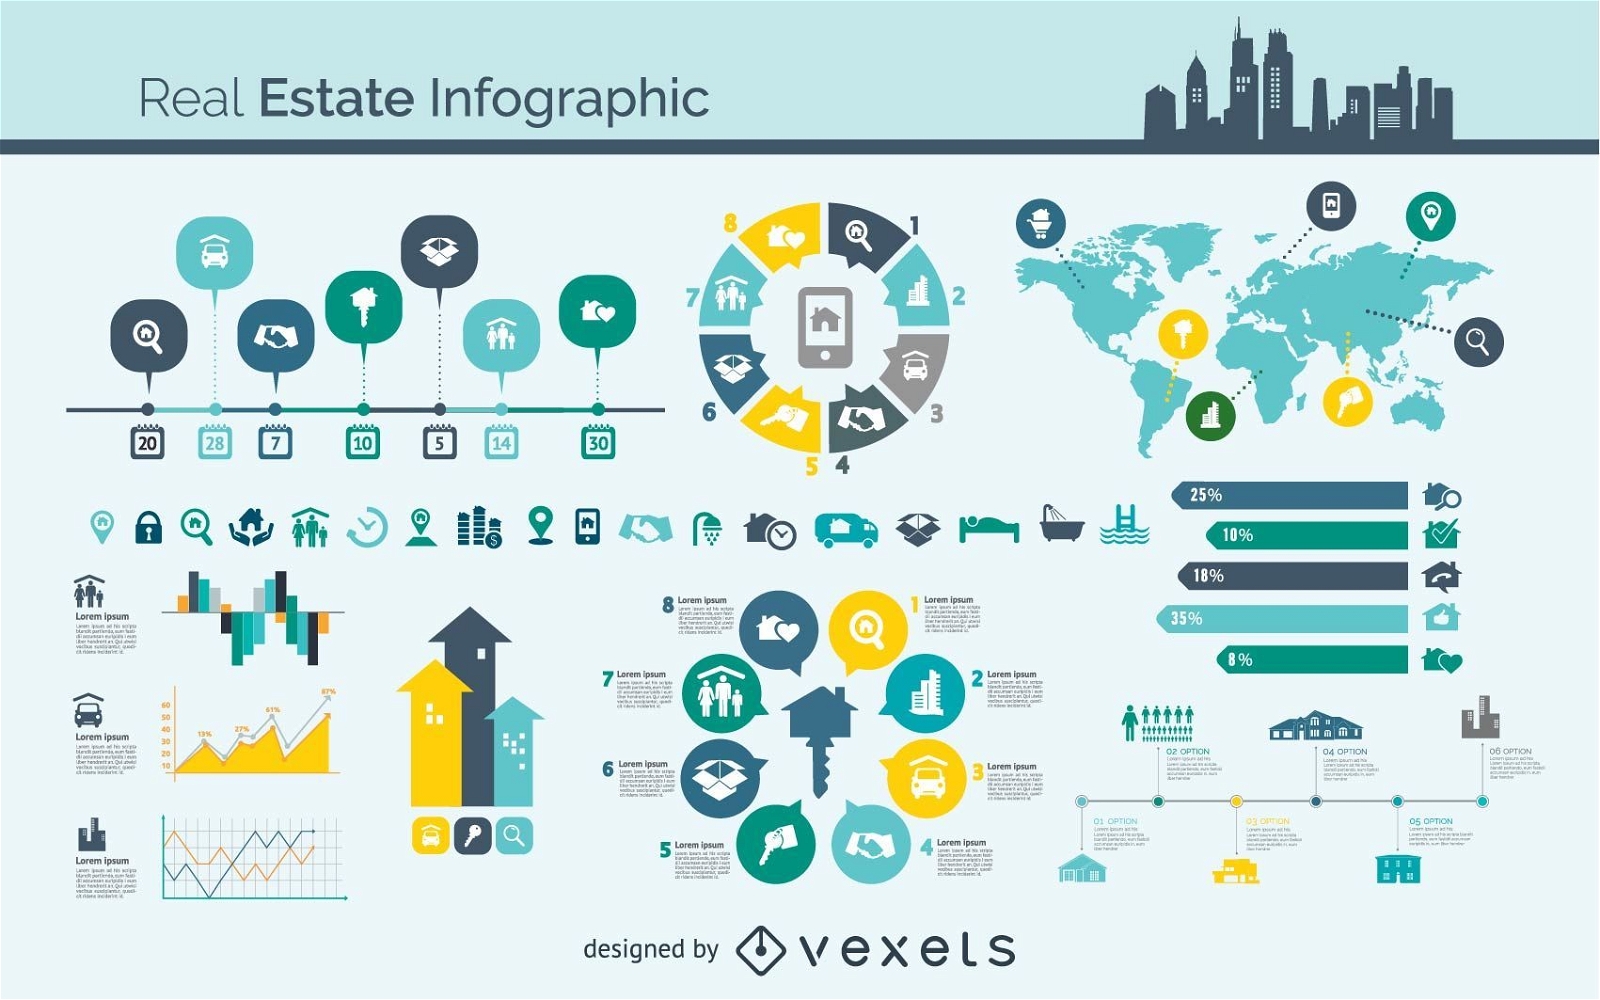
Real Estate Infographic Vector
Choose a folder
All favorites
Create new
Save
Real Estate Infographic Vector
Retro Flat Healthcare Infographic
Choose a folder
All favorites
Create new
Save
Retro Flat Healthcare Infographic
Woman ideas infographic social clouds concept
Choose a folder
All favorites
Create new
Save
Woman ideas infographic social clouds concept
40 Plus Minimalist Info Graphics with Icons
Choose a folder
All favorites
Create new
Save
40 Plus Minimalist Info Graphics with Icons
Business strategy gear infographics
Choose a folder
All favorites
Create new
Save
Business strategy gear infographics
Hand drawn infographic elements
Choose a folder
All favorites
Create new
Save
Hand drawn infographic elements
Infographics
Choose a folder
All favorites
Create new
Save
Infographics
7 Infographic statistics 3D elements
Choose a folder
All favorites
Create new
Save
7 Infographic statistics 3D elements
Globe Pack with Map Around
Choose a folder
All favorites
Create new
Save
Globe Pack with Map Around
Shiny Arrow Circle
Choose a folder
All favorites
Create new
Save
Shiny Arrow Circle
50 Financial and business icons
Choose a folder
All favorites
Create new
Save
50 Financial and business icons
78 Menu tool icons set
Choose a folder
All favorites
Create new
Save
78 Menu tool icons set
Social Media Marketing
Choose a folder
All favorites
Create new
Save
Social Media Marketing
Transport means doodle infographics
Choose a folder
All favorites
Create new
Save
Transport means doodle infographics
Beautiful Financial Icon Set
Choose a folder
All favorites
Create new
Save
Beautiful Financial Icon Set
26 Business information icons
Choose a folder
All favorites
Create new
Save
26 Business information icons
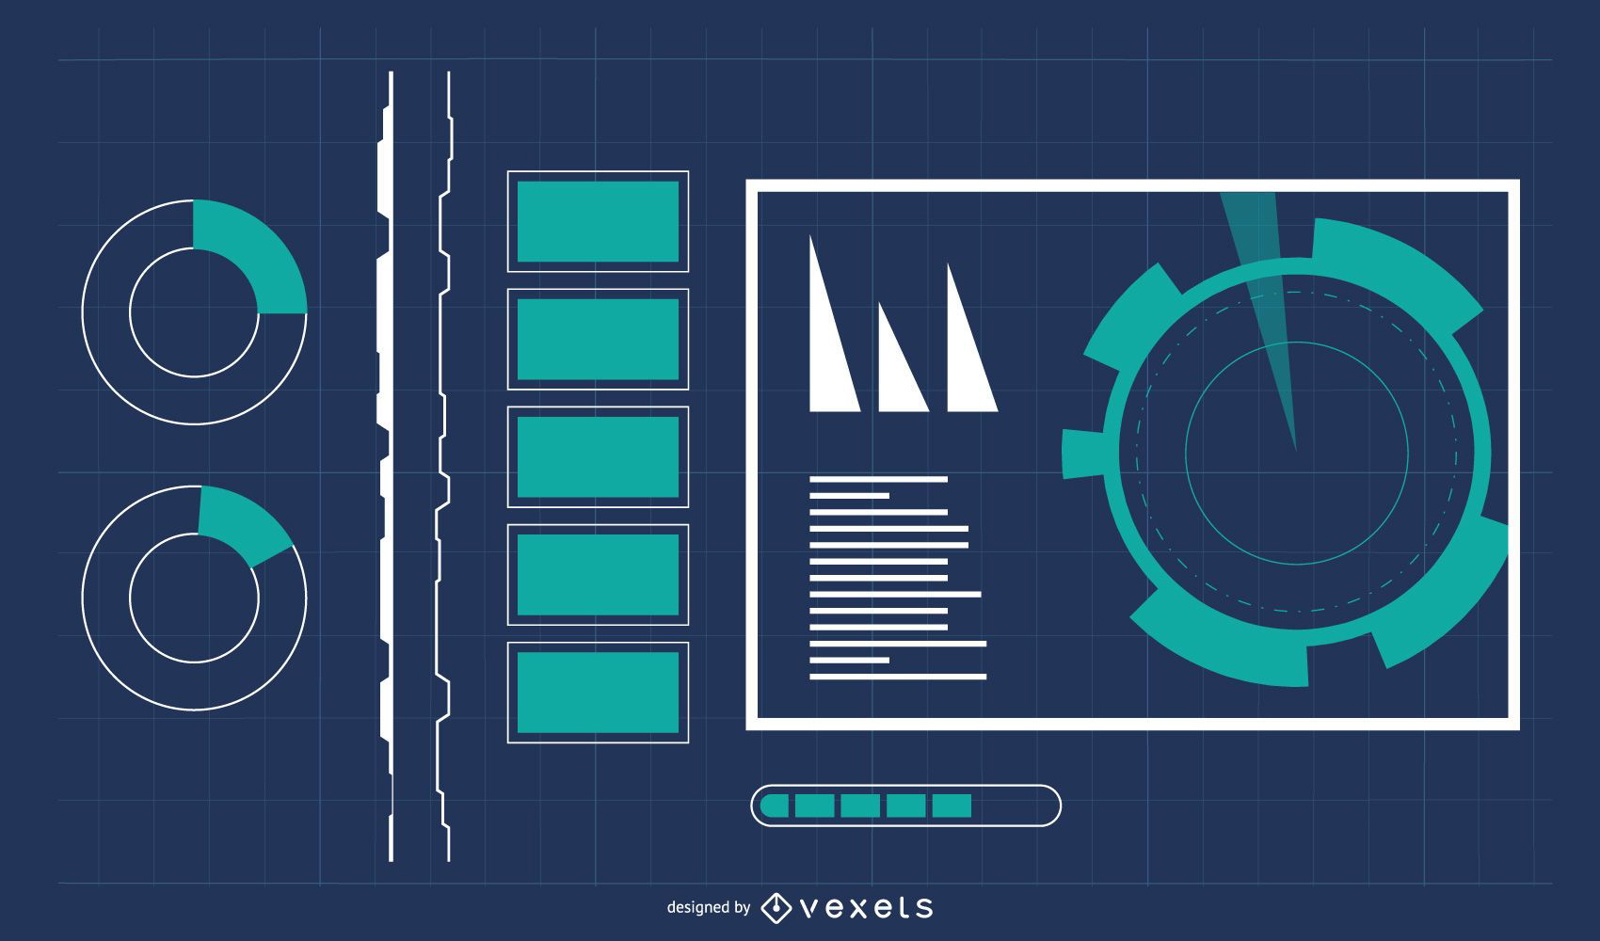
Digital Technology Background with Info-Graphic
Choose a folder
All favorites
Create new
Save
Digital Technology Background with Info-Graphic
Young Businessman Showing Bar Graph
Choose a folder
All favorites
Create new
Save
Young Businessman Showing Bar Graph
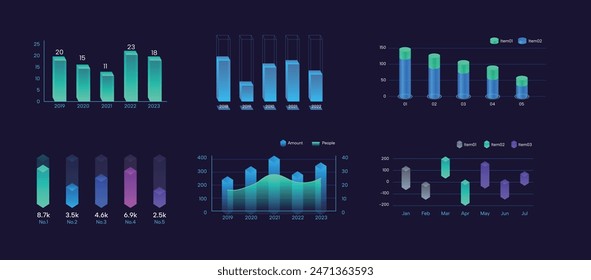
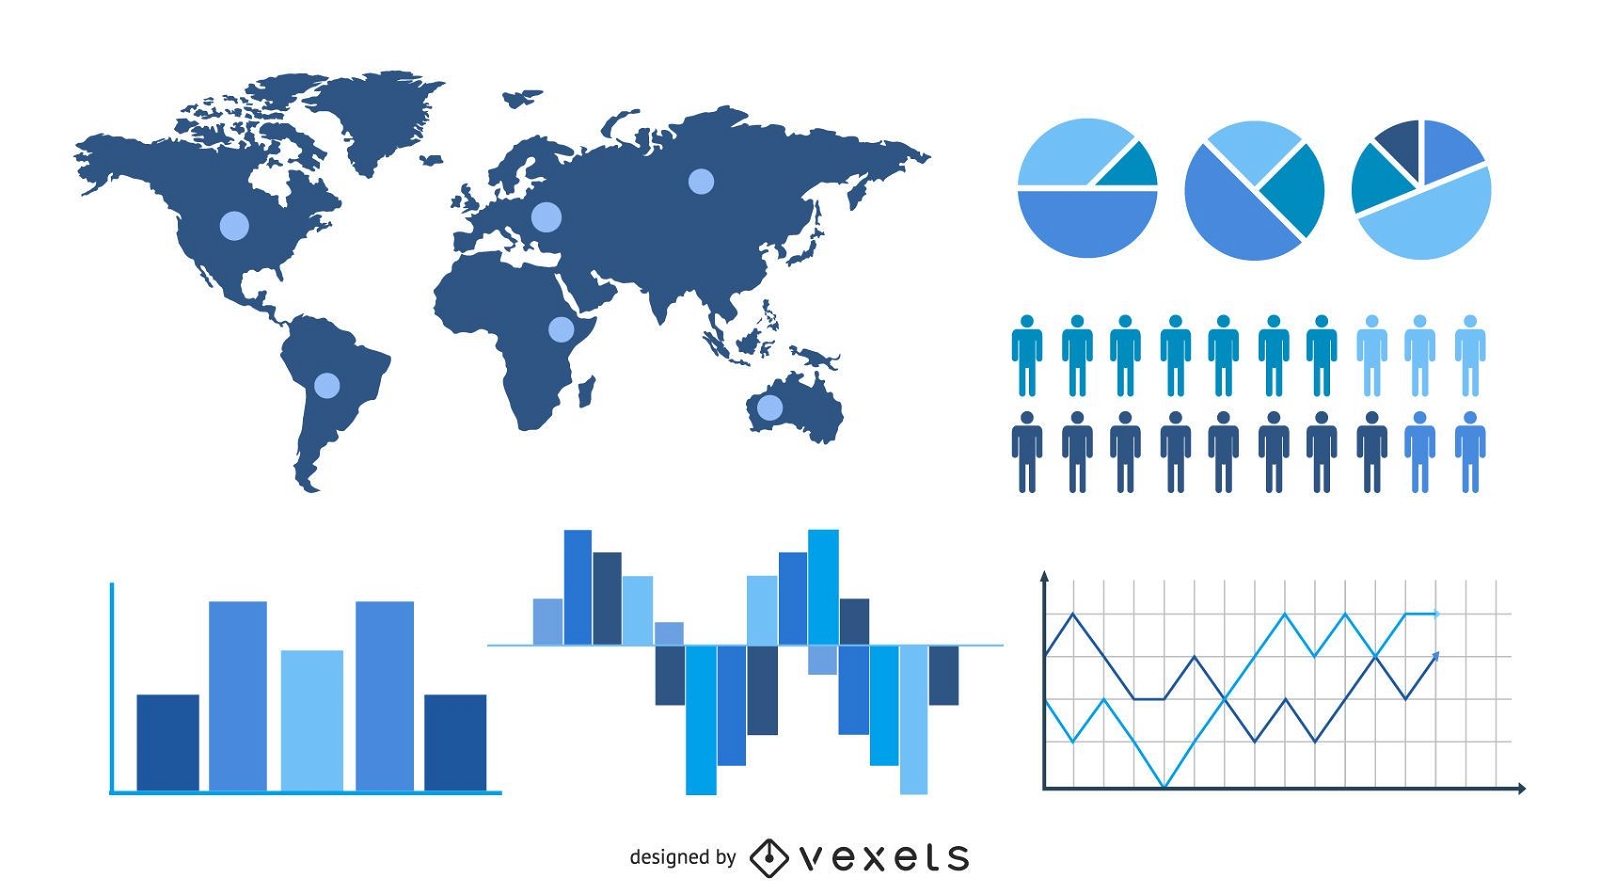
Statistic & Analytical Infographic Set
Choose a folder
All favorites
Create new
Save
Statistic & Analytical Infographic Set
Editable text
Premium
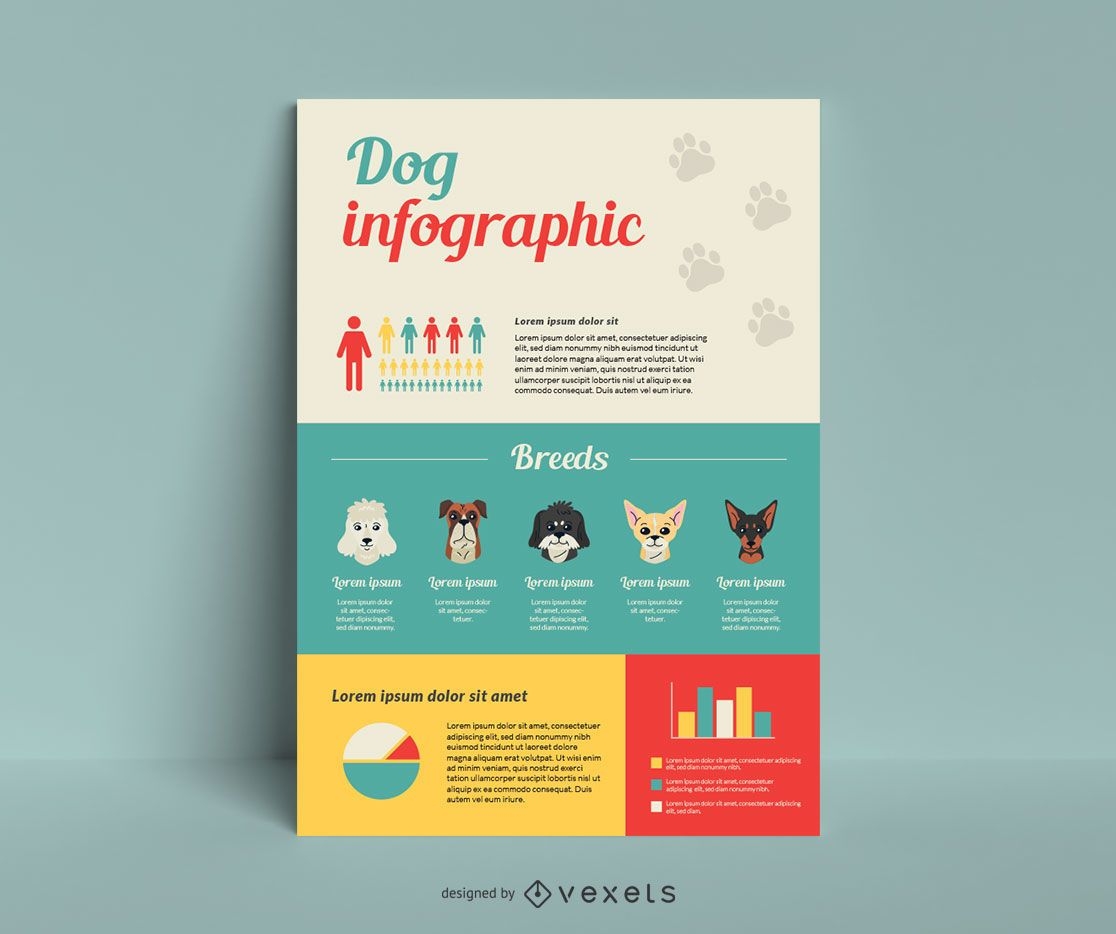
Dog breed infographic template
Choose a folder
All favorites
Create new
Save
Dog breed infographic template
Premium
Space Themed Alphabet Set
Choose a folder
All favorites
Create new
Save
Space Themed Alphabet Set
Isometric Vector icons
Choose a folder
All favorites
Create new
Save
Isometric Vector icons
Subscribe
To Get High-Quality Commercial Use Designs For Your Business
SEE PLANS
Next
of 5
prev page
next page