Design Library
Explore Designs
New Merch Designs
Trending Merch Designs
Vectors
PNGs & SVGs
Mockups
T-Shirts
T-Shirt PSD Templates
KDP Designs
Phone Cases
Pillows
Tote Bags
Posters
Mugs
Design Tools
Designer
New!
T-shirt Maker
Mockup Generator
Quote Generator
Logo Maker
Resources
Merch Digest
Blog
Help Center
Creators Program
Learn About Merch
Changelog
Pricing
Loading...
Sign Up
Login
All
chart
Design Library
Explore Designs
New Merch Designs
Trending Merch Designs
Vectors
PNGs & SVGs
Mockups
T-Shirts
T-Shirt PSD Templates
KDP Designs
Phone Cases
Pillows
Tote Bags
Posters
Mugs
Design Tools
Designer
New!
T-shirt Maker
Mockup Generator
Quote Generator
Logo Maker
Resources
Merch Digest
Blog
Help Center
Creators Program
Learn About Merch
Changelog
PLANS
All
chart
511 chart designs graphics for t-shirt and print on demand merch
Download chart t-shirt designs and other merch graphics like book covers, phone cases, tote bags and more.
Related:
charts
,
pie chart
,
pie charts
Sort by
Most relevant
Sponsored results by
Get 15% off with code: VEXELS15
Show more
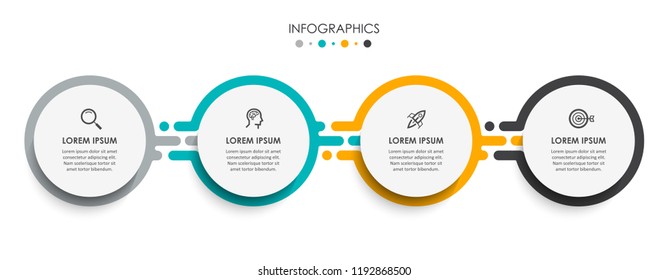
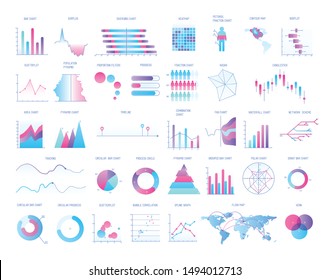
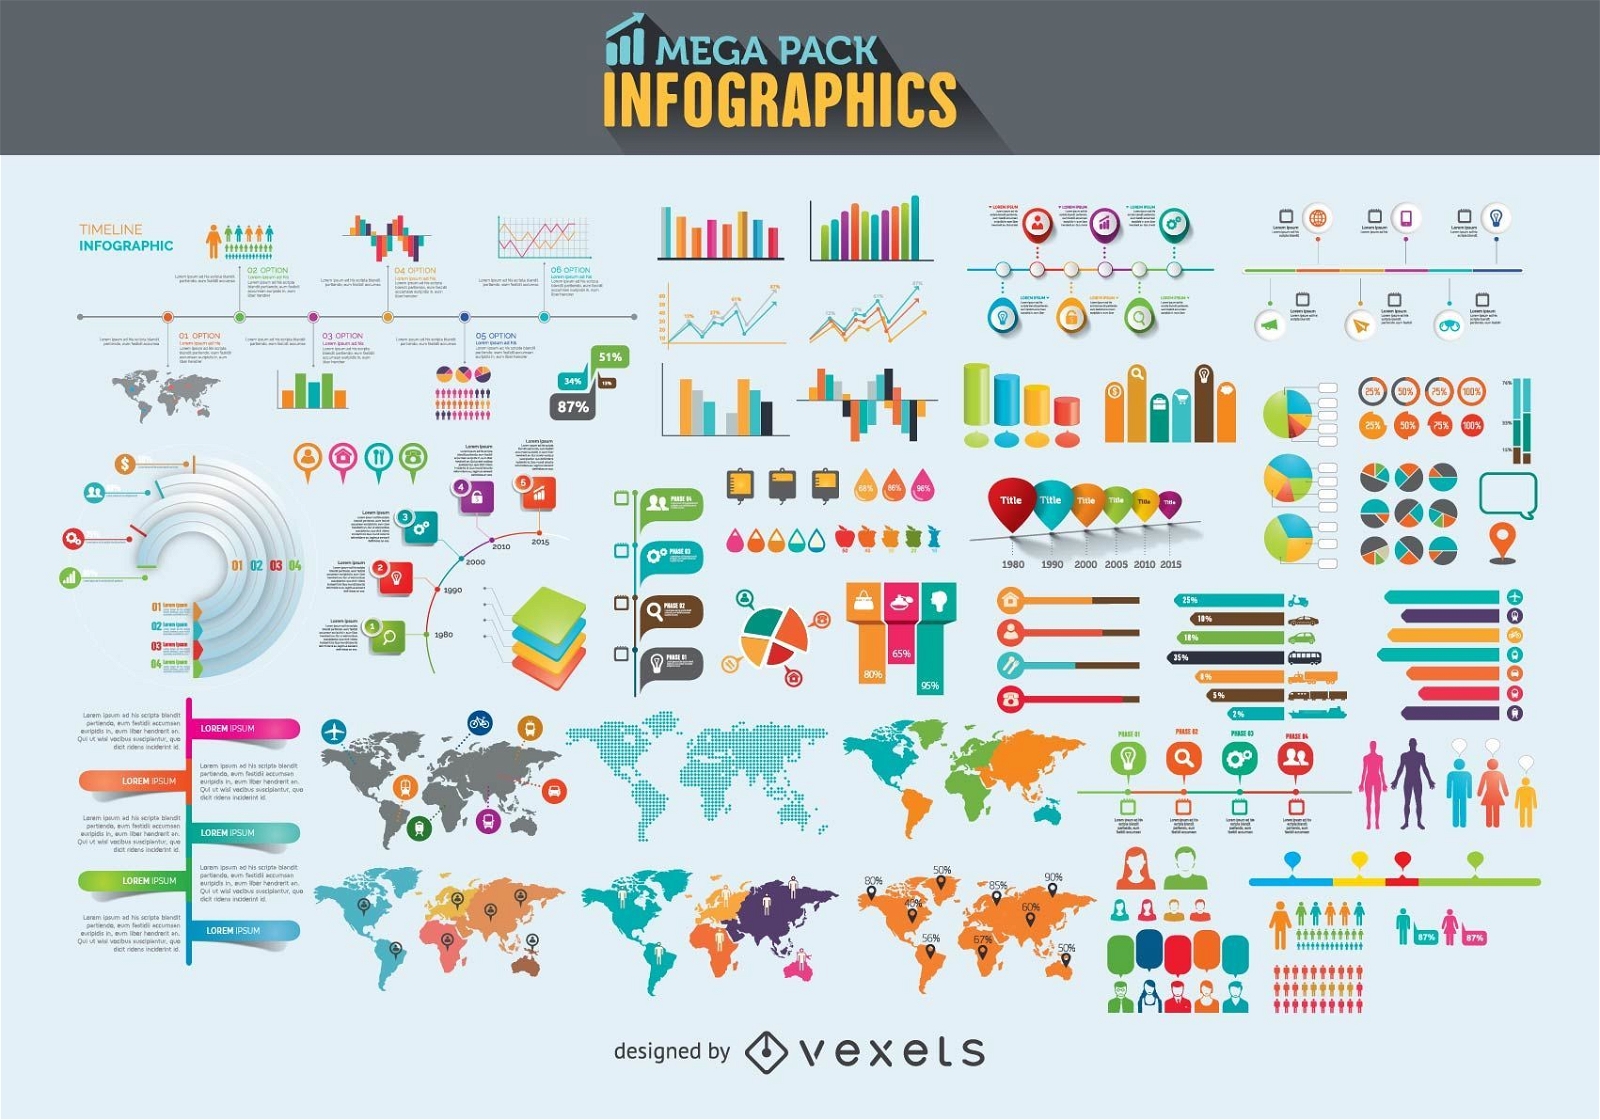
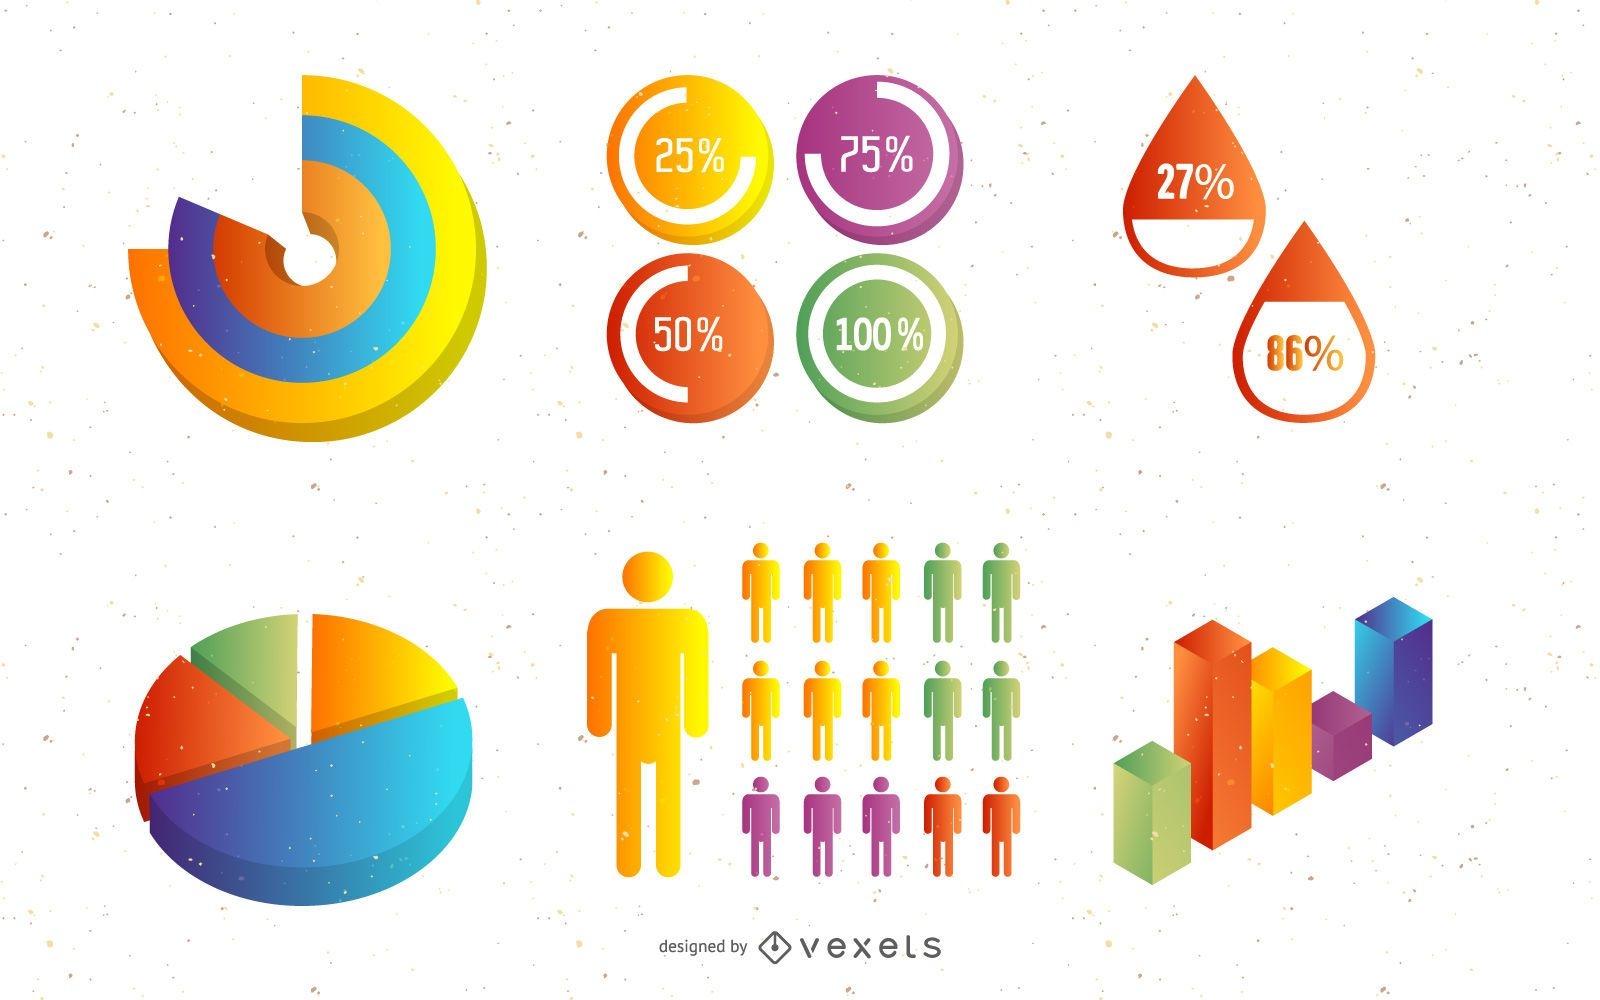
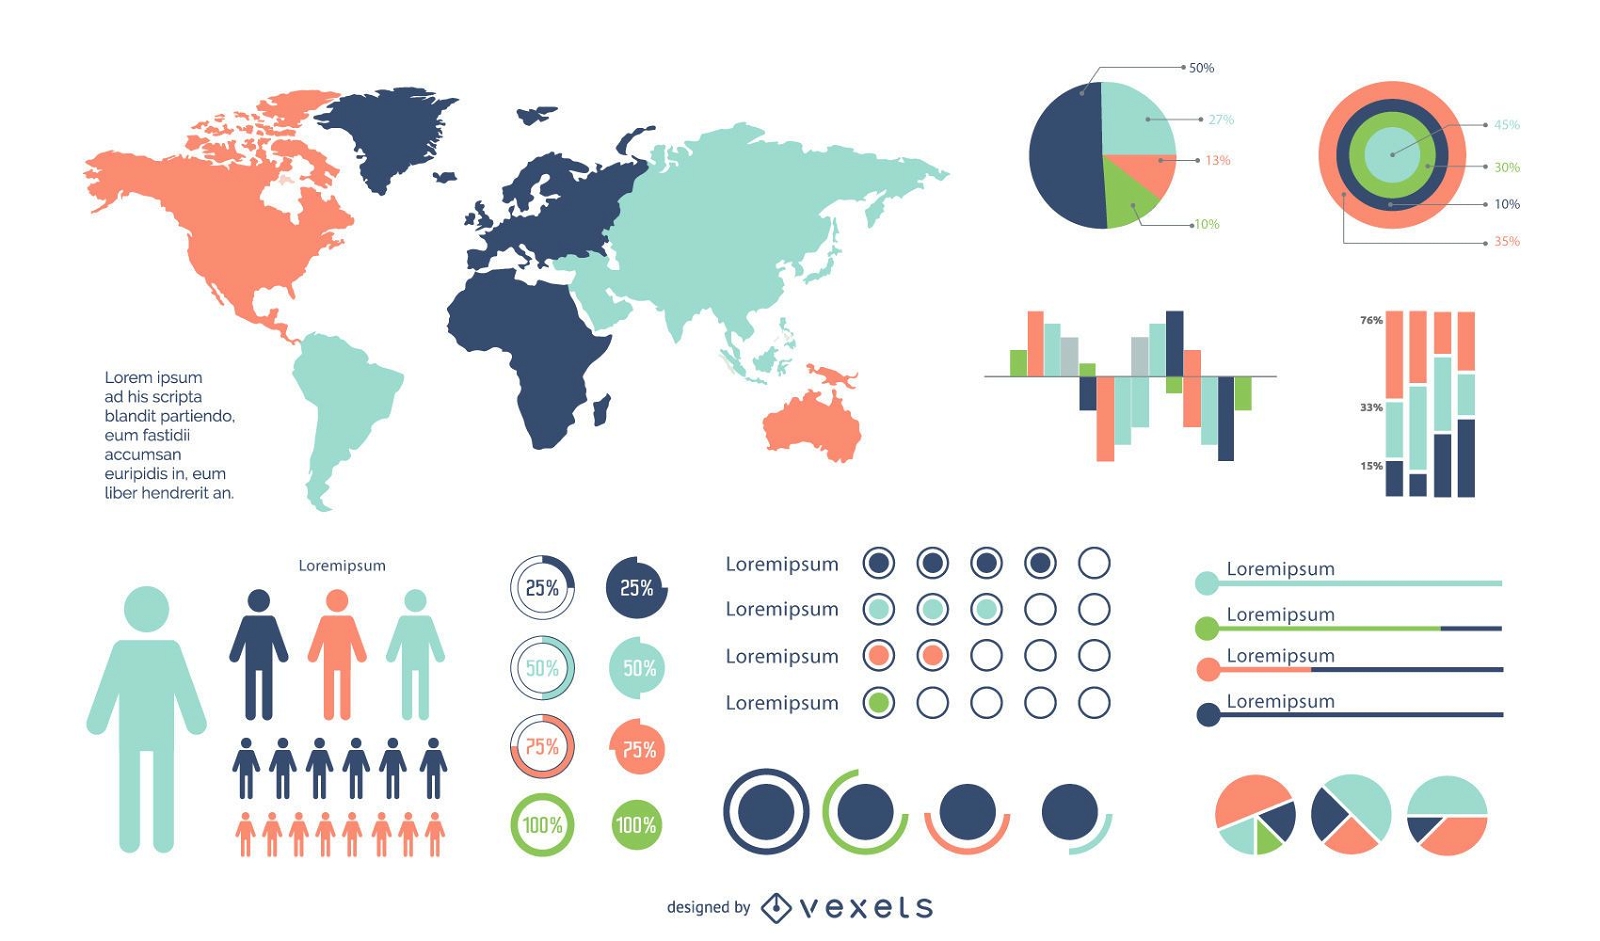
Infographics elements mega pack
Choose a folder
All favorites
Create new
Save
Infographics elements mega pack
Premium
Refill water drinking chart PNG Design
Choose a folder
All favorites
Create new
Save
Refill water drinking chart PNG Design
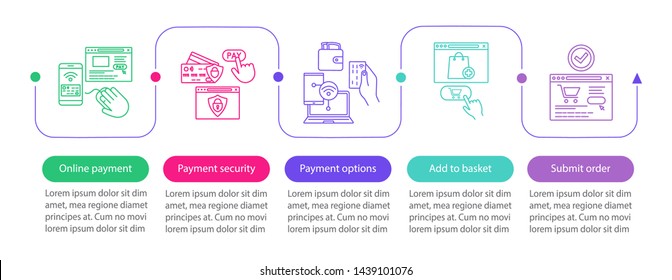
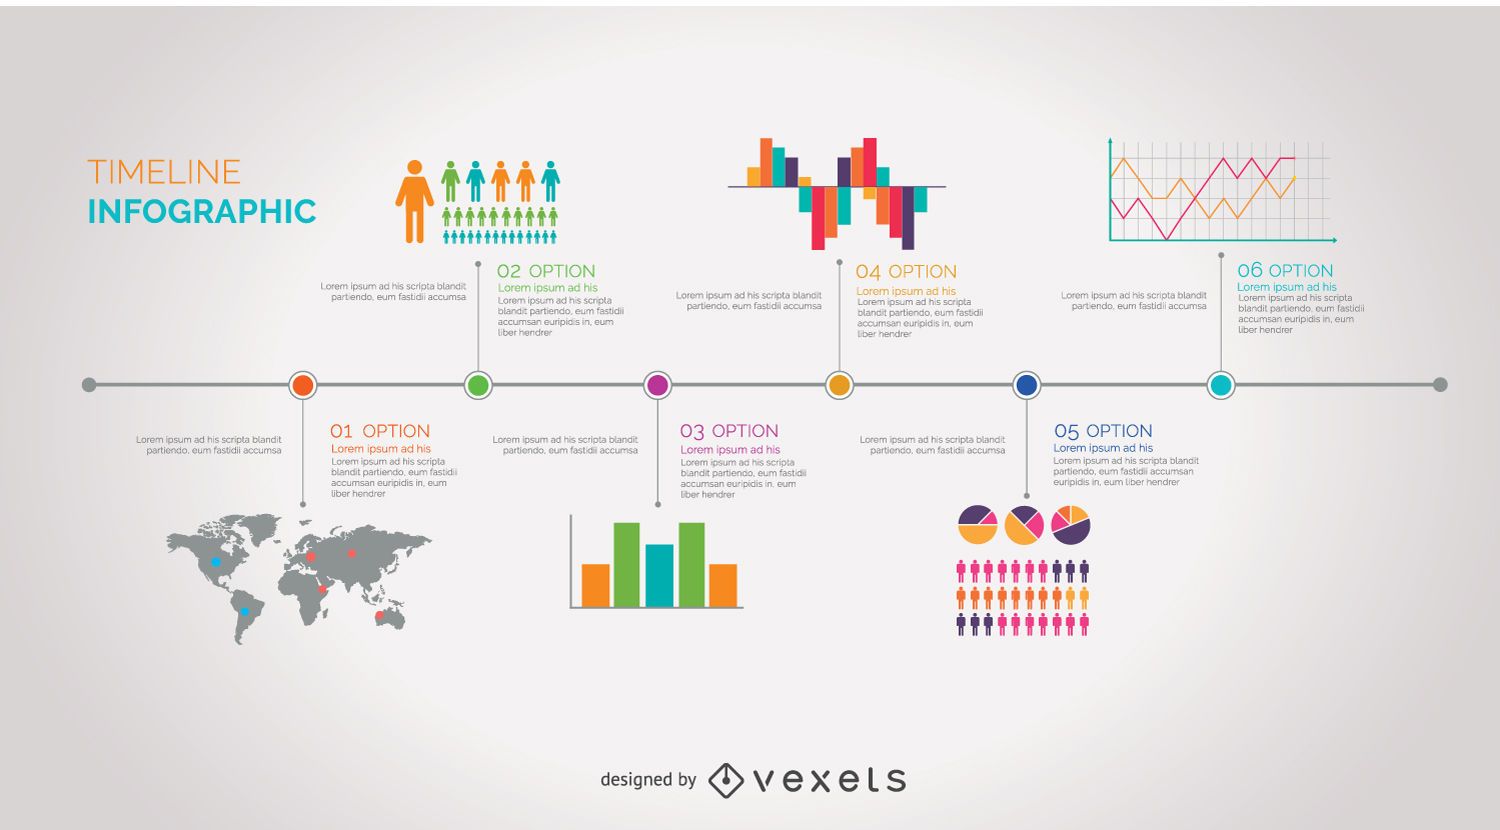
Infographic Timeline
Choose a folder
All favorites
Create new
Save
Infographic Timeline
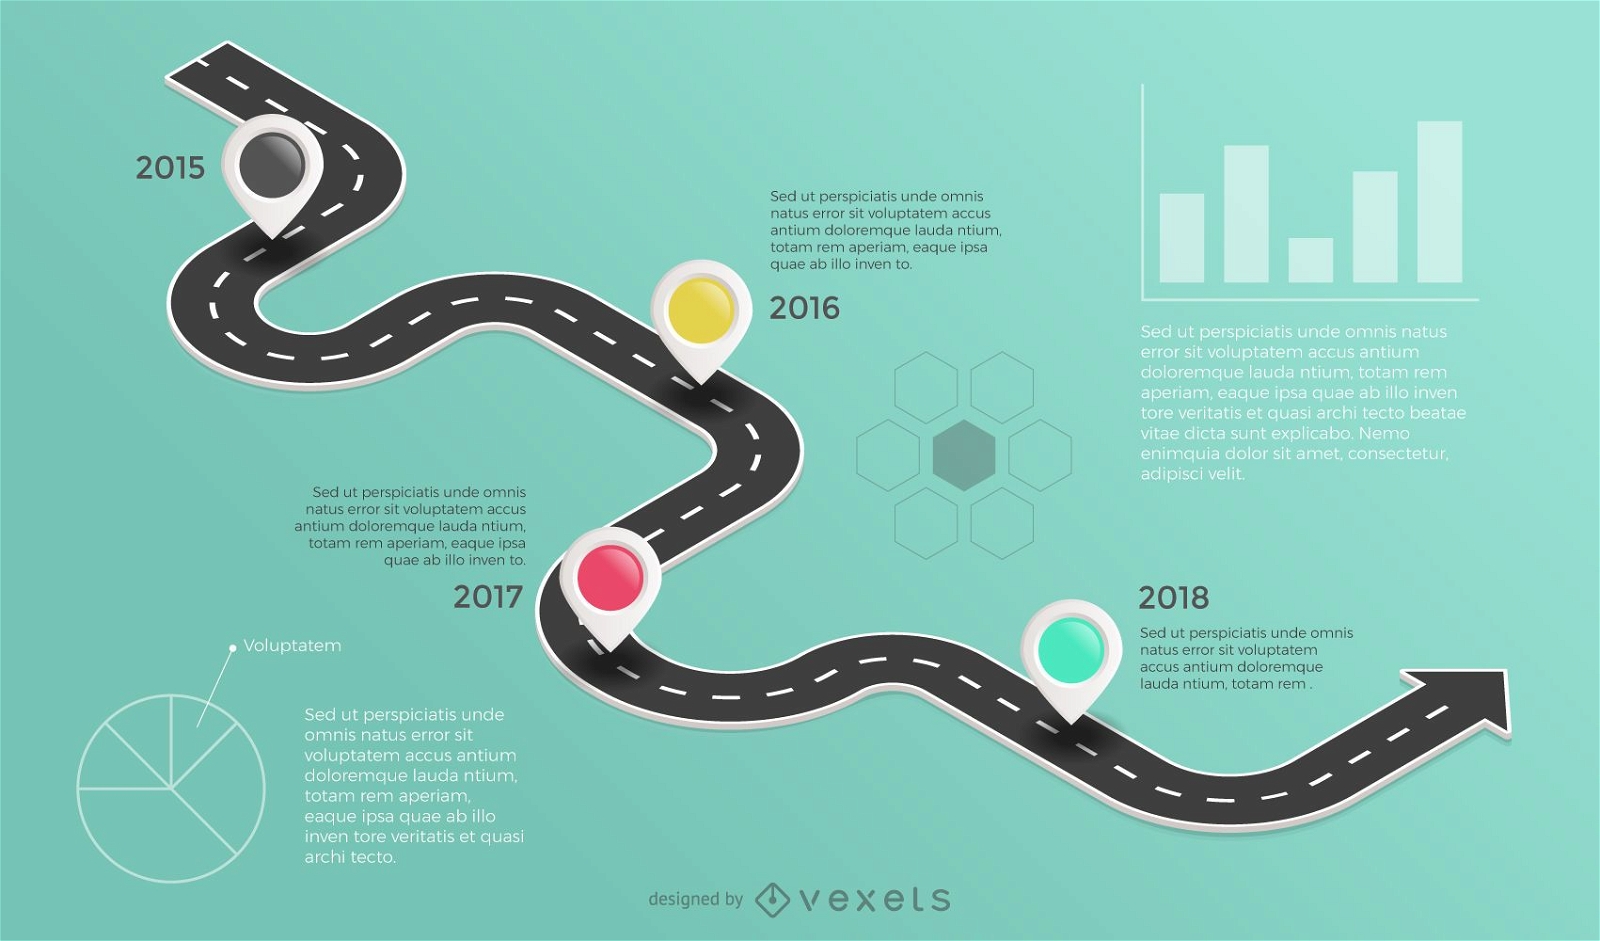
Roadmap infographic
Choose a folder
All favorites
Create new
Save
Roadmap infographic
Heart with life line
Choose a folder
All favorites
Create new
Save
Heart with life line
50 percent progress circle PNG Design
Choose a folder
All favorites
Create new
Save
50 percent progress circle PNG Design
104 Flat Business Icon set
Choose a folder
All favorites
Create new
Save
104 Flat Business Icon set
Businessman character several poses
Choose a folder
All favorites
Create new
Save
Businessman character several poses
Premium
Male body medical pose PNG Design
Choose a folder
All favorites
Create new
Save
Male body medical pose PNG Design
Premium
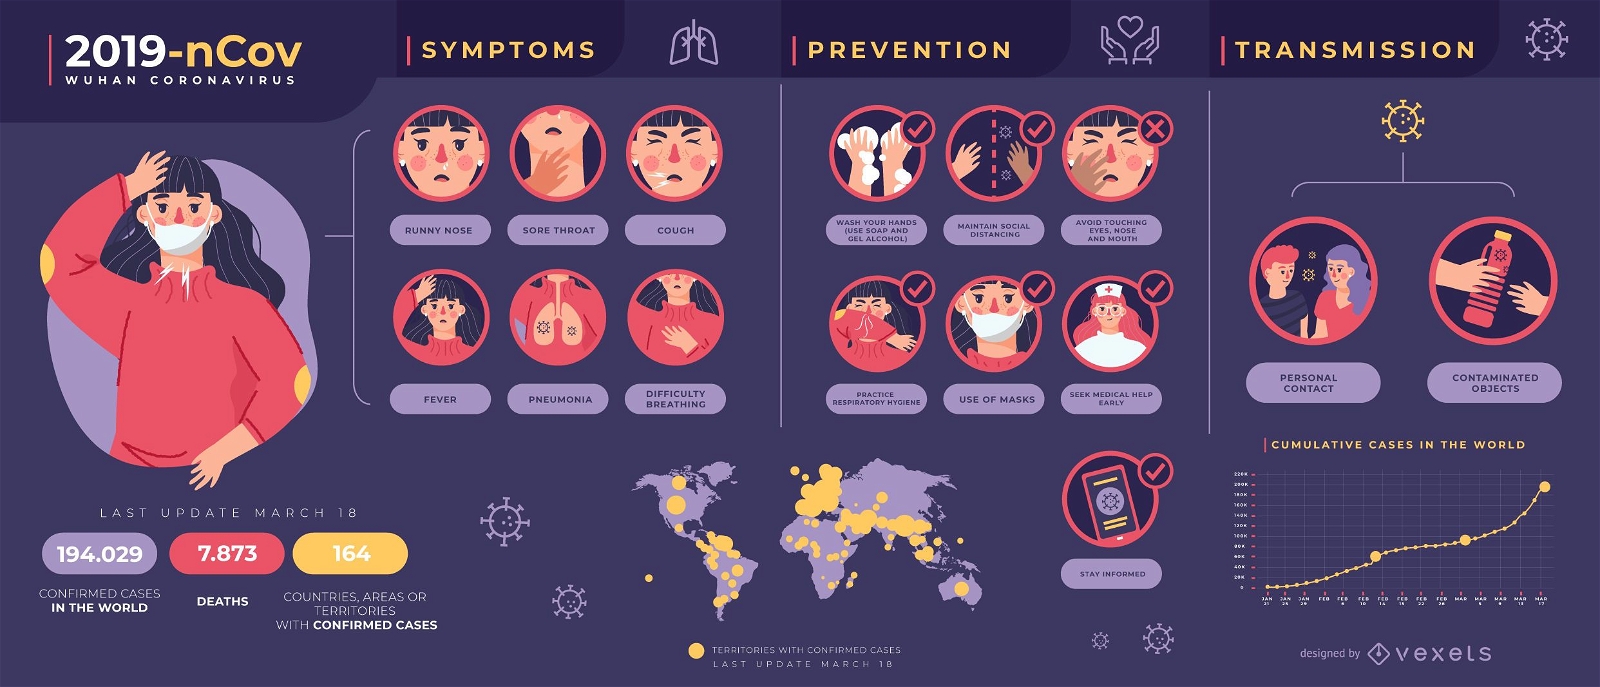
Covid-19 coronavirus infographic template
Choose a folder
All favorites
Create new
Save
Covid-19 coronavirus infographic template
Premium
Black tarot card telling the fortune PNG Design
Choose a folder
All favorites
Create new
Save
Black tarot card telling the fortune PNG Design
100 percent circle graph PNG Design
Choose a folder
All favorites
Create new
Save
100 percent circle graph PNG Design
Premium
Marketing graph icon PNG Design
Choose a folder
All favorites
Create new
Save
Marketing graph icon PNG Design
Businessman cartoon showing graph tab PNG Design
Choose a folder
All favorites
Create new
Save
Businessman cartoon showing graph tab PNG Design
Business And Finance Icons Design Set
Choose a folder
All favorites
Create new
Save
Business And Finance Icons Design Set
Glossy 3D Creative Infographic Pack Template
Choose a folder
All favorites
Create new
Save
Glossy 3D Creative Infographic Pack Template
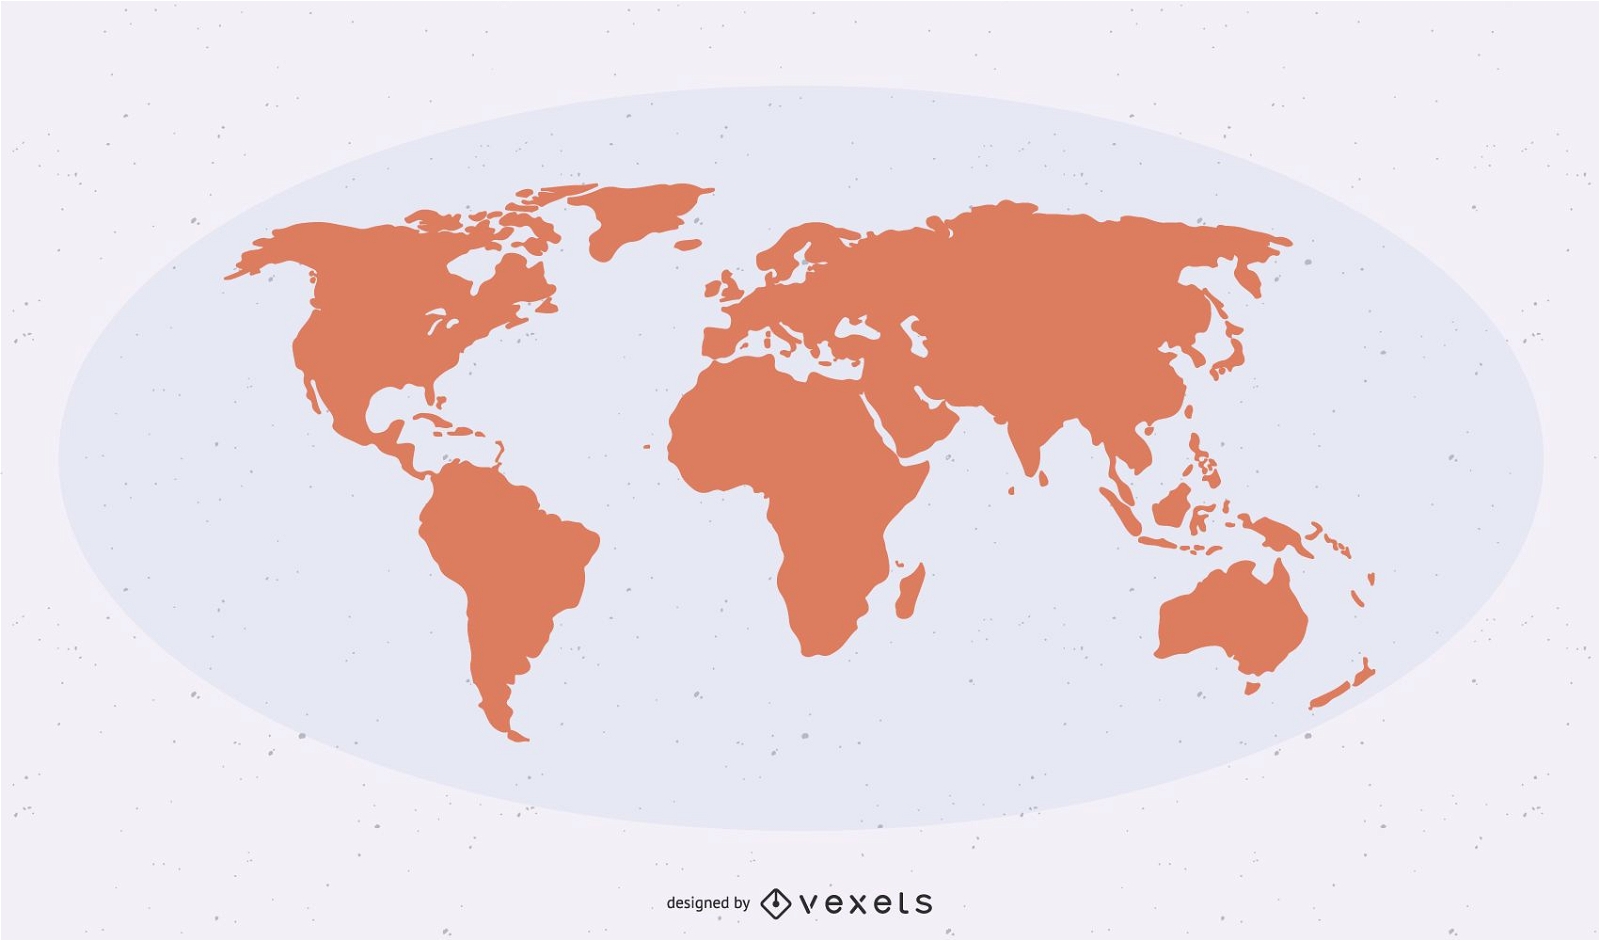
Flat Detailed Shape World Map
Choose a folder
All favorites
Create new
Save
Flat Detailed Shape World Map
Premium
Solar system cut out design PNG Design
Choose a folder
All favorites
Create new
Save
Solar system cut out design PNG Design
Premium
Business doodle icons collection
Choose a folder
All favorites
Create new
Save
Business doodle icons collection
Premium
The Devil card in a skeleton-themed tarot PNG Design
Choose a folder
All favorites
Create new
Save
The Devil card in a skeleton-themed tarot PNG Design
Premium
The Fool card in a skeleton-themed tarot PNG Design
Choose a folder
All favorites
Create new
Save
The Fool card in a skeleton-themed tarot PNG Design
Premium
Esoteric tarot card PNG Design
Choose a folder
All favorites
Create new
Save
Esoteric tarot card PNG Design
Premium
Graph circle icon PNG Design
Choose a folder
All favorites
Create new
Save
Graph circle icon PNG Design
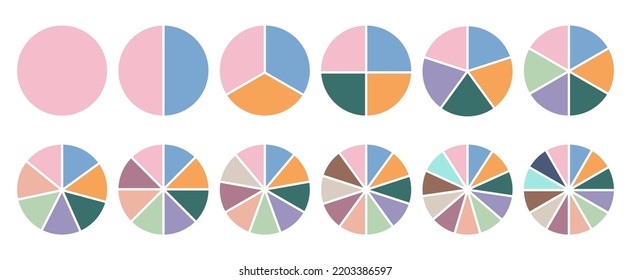
Minimal Colorful Infographic Set
Choose a folder
All favorites
Create new
Save
Minimal Colorful Infographic Set
25 percent circular progress tag PNG Design
Choose a folder
All favorites
Create new
Save
25 percent circular progress tag PNG Design
Medical element set
Choose a folder
All favorites
Create new
Save
Medical element set
Business icons doodle set
Choose a folder
All favorites
Create new
Save
Business icons doodle set
Businessman showing growing charts
Choose a folder
All favorites
Create new
Save
Businessman showing growing charts
Production to delivery diagram PNG Design
Choose a folder
All favorites
Create new
Save
Production to delivery diagram PNG Design
Premium
Person infographic pie PNG Design
Choose a folder
All favorites
Create new
Save
Person infographic pie PNG Design
Premium
Eye-catching Lovers tarot card PNG Design
Choose a folder
All favorites
Create new
Save
Eye-catching Lovers tarot card PNG Design
Glossy Colorful Infographic Elements
Choose a folder
All favorites
Create new
Save
Glossy Colorful Infographic Elements
Print ready
for Merch
Space rocket flying over graph t-shirt design
Choose a folder
All favorites
Create new
Save
Space rocket flying over graph t-shirt design
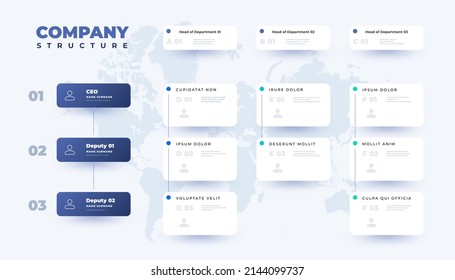
30 Plus Info Graphic Set with Maps and Statistics
Choose a folder
All favorites
Create new
Save
30 Plus Info Graphic Set with Maps and Statistics
Premium
Scorpio sign in the horoscope PNG Design
Choose a folder
All favorites
Create new
Save
Scorpio sign in the horoscope PNG Design
Premium
Live by the sun love by the moon PNG Design
Choose a folder
All favorites
Create new
Save
Live by the sun love by the moon PNG Design
Premium
The hierophant tarot card PNG Design
Choose a folder
All favorites
Create new
Save
The hierophant tarot card PNG Design
Big idea hand drawn design
Choose a folder
All favorites
Create new
Save
Big idea hand drawn design
Premium
The Justice card in a skeleton-themed tarot PNG Design
Choose a folder
All favorites
Create new
Save
The Justice card in a skeleton-themed tarot PNG Design
Premium
Growing bar graphs PNG Design
Choose a folder
All favorites
Create new
Save
Growing bar graphs PNG Design
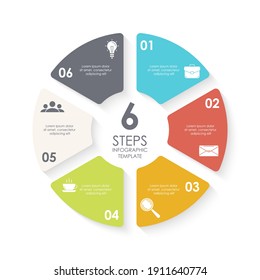
Infographics elements
Choose a folder
All favorites
Create new
Save
Infographics elements
Premium
Female body medical pose PNG Design
Choose a folder
All favorites
Create new
Save
Female body medical pose PNG Design
Business doodle hand drawn elements
Choose a folder
All favorites
Create new
Save
Business doodle hand drawn elements
Premium
Black tarot card PNG Design
Choose a folder
All favorites
Create new
Save
Black tarot card PNG Design
Premium
Leo sign in the horoscope PNG Design
Choose a folder
All favorites
Create new
Save
Leo sign in the horoscope PNG Design
Premium
The emperor tarot card PNG Design
Choose a folder
All favorites
Create new
Save
The emperor tarot card PNG Design
Premium
The chariot tarot card PNG Design
Choose a folder
All favorites
Create new
Save
The chariot tarot card PNG Design
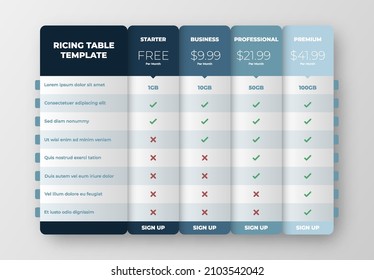
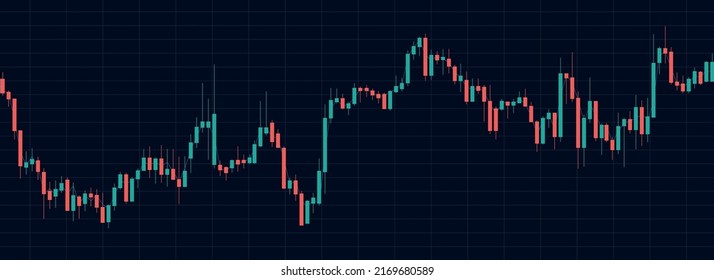
Creative Statistic Charts Infographic Set
Choose a folder
All favorites
Create new
Save
Creative Statistic Charts Infographic Set
4 Business bookmark banners
Choose a folder
All favorites
Create new
Save
4 Business bookmark banners
Premium
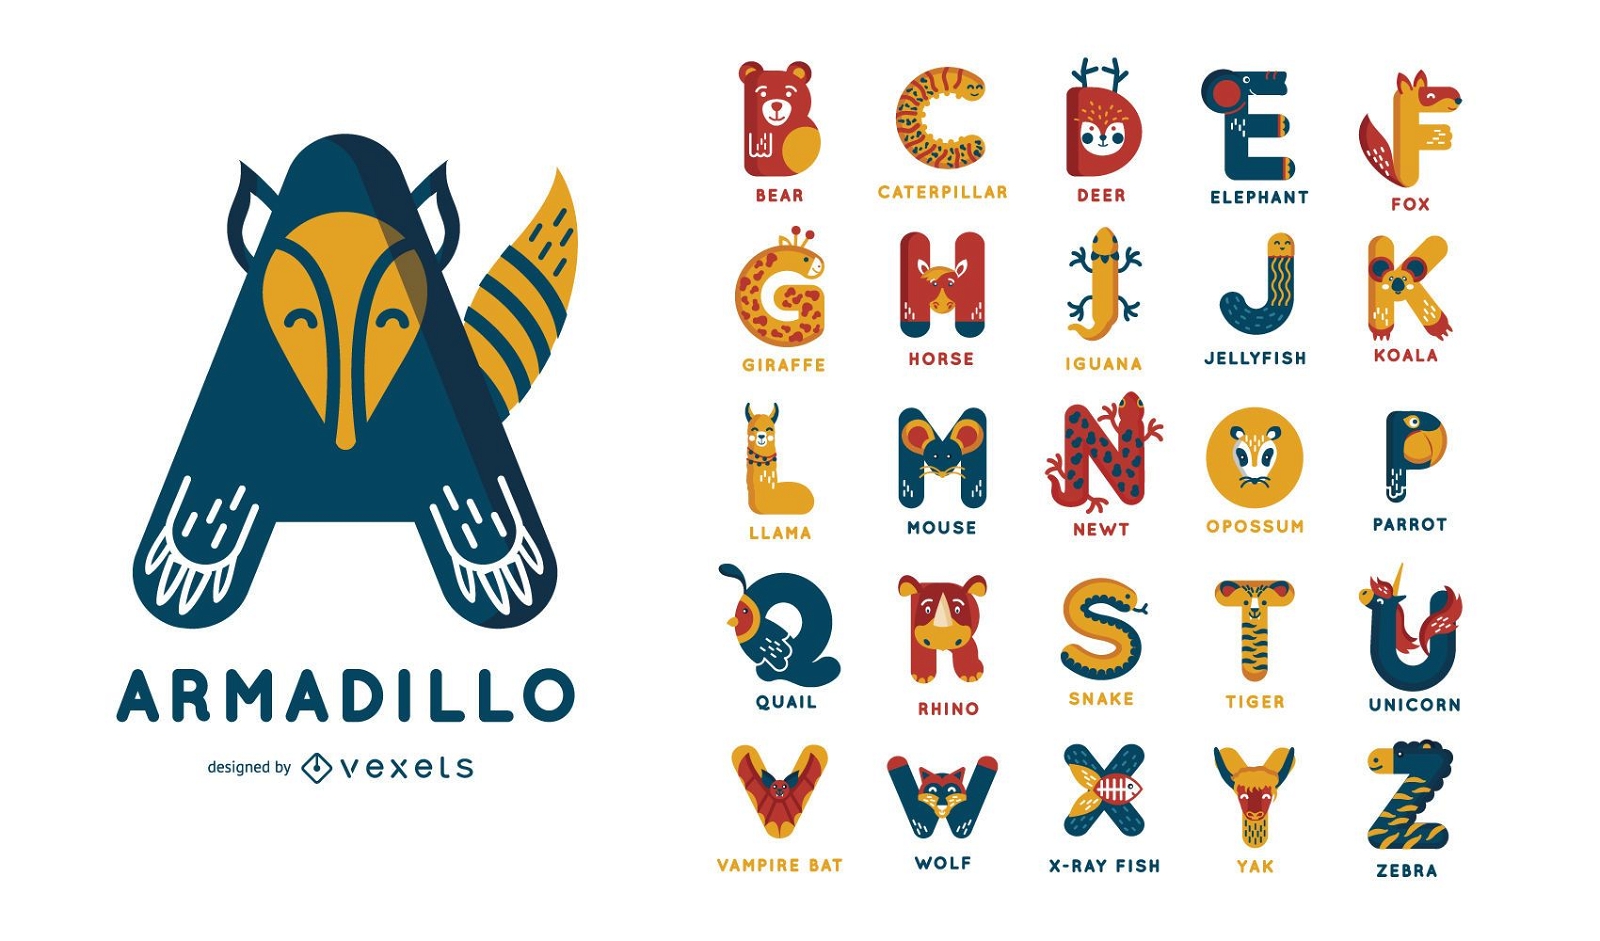
Animal Themed Alphabet Set
Choose a folder
All favorites
Create new
Save
Animal Themed Alphabet Set
Boost Your Business
With The Leading Graphic Platform For Merch.
SEE PLANS
Next
of 11
prev page
next page